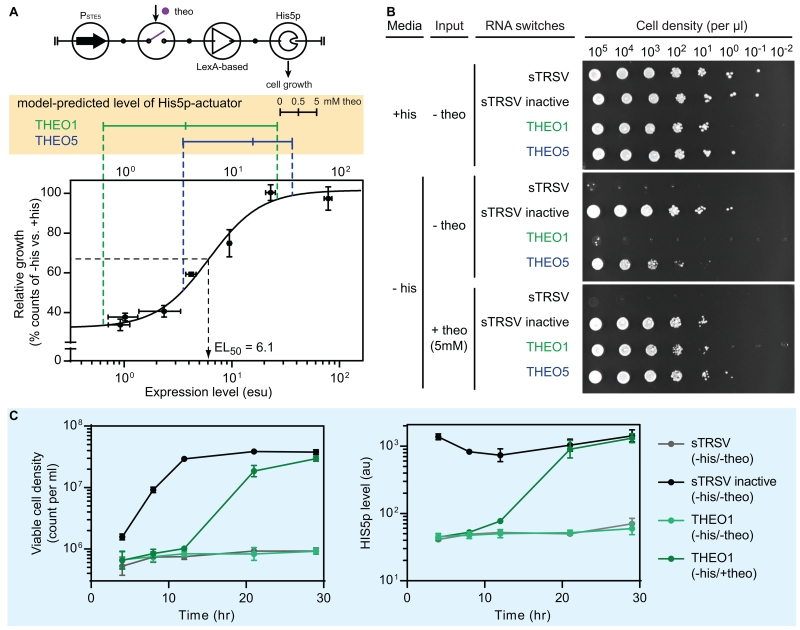
Figure 4. Application of the gene activation controller to control a cellular phenotype.
(A) Circuit symbol of the His5p-activator (top) and model-predicted His5p-activator performance. The His5p-dependent cell growth model (bottom) was obtained by fitting the cellular growth data (dots in the plot with error bars as ± 1 s.d.) with a Hill function. The protein levels of two His5p-activators (THEO1 in green and THEO5 in blue) were simulated (Monte Carlo, N = 5000) at three input levels (0, 0.5, and 5 mM of theophylline). The median values of the simulation results are displayed (yellow box). See also Figure S4A and STAR Methods for modeling details.
(B) A serial dilution plating experiment to assess input-controlled cellular growth. Yeast strains harboring the His5p-activators (sTRSV, sTRSV inactive, THEO1, and THEO5) were grown stationary phase, and diluted into a series (from 105 to 10−2 viable cells per μL). Two μL of each dilution were plated under three conditions: presence of the auxotrophic nutrient (+his, −theo), absence of nutrient and input (−his, −theo), and presence of input (−his, +theo). The assay was conducted in three biological replicates. See also Figure S4B.
(C) Time course cellular growth assays with His5p-activators. Strains harboring three His5p-activators (sTRSV, sTRSV inactive, and THEO1) were grown under two conditions: absence of nutrient and input (-his, -theo) and presence of input (-his, +theo). Viable cell counts and protein levels were measured over the course of experiment. Data are plotted as the mean values and error bars represent ± 1 s.d. of three biological replicates.
Abbreviations: his: histidine; theo: theophylline; sTRSV: small satellite RNA of tobacco ringspot virus (a self-cleavable ribozyme); sTRSV inactive: a non-cleavable mutant of sTRSV.

