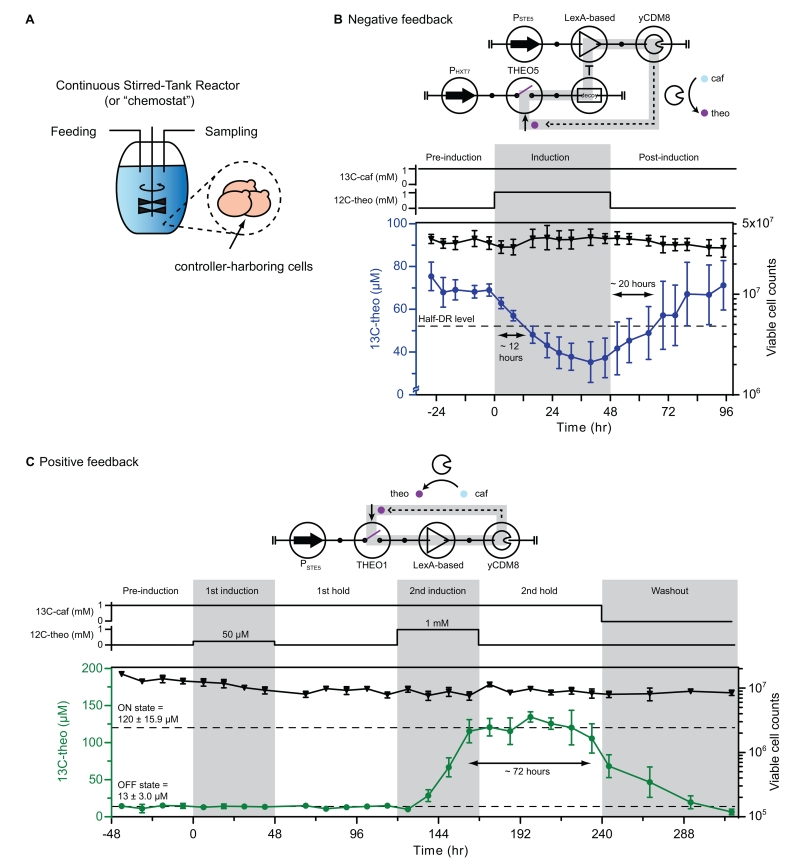
Figure 6. Dynamic characterization of positive and negative feedback systems.
(A) Schematic of continuous stirred-tank reactor (chemostat) (left). The chemostat was fed 13C-caf continuously and 12C-theo was pulsed during the induction period (right). The dilution rate was set to 5% per hour (~ 1 mL of a total 20 mL volume). Samples were collected every 6 hours during a 6-day experiment (for NFB) or every 12 hours during a 15-day experiment (for PFB). 13C-caf, 13C-theo, and 12C-theo in the media were quantified using LC-MS and viable cell counts were measured using flow cytometry.
(B) Circuit symbol of a negative feedback system built with THEO5-based yCDM8-repressor (left). The negative feedback (grey loop) is established through the antagonizing activity between actuator expression (yCDM8) and the signal level (theophylline). The construct was characterized as Figure 6A. Each data point represents the mean value and error bars represent ± 1 s.d. of four biological replicates. The dash line represents the half dynamic range (half-DR) level (i.e., 52.5 μM). The double arrows indicate the half-DR fall time (first) and rise time (second) of the characterized system. See also Figures S5C and S6B.
(C) Circuit symbol of a positive feedback system built with THEO1-based yCDM8-activator (left). The positive feedback (grey loop) is established through the synergistic activity between actuator expression (yCDM8) and the signal level (theophylline), resulting in bistable production states. The construct was characterized as Figure 6A. Each data point represents the mean value and error bars represent ± 1 s.d. of three biological replicates. The double arrows indicate the hold time for ON state of the characterized system. See also Figures S5A, S5B, and S6C.
Abbreviations: caf: caffeine; theo: theophylline.

