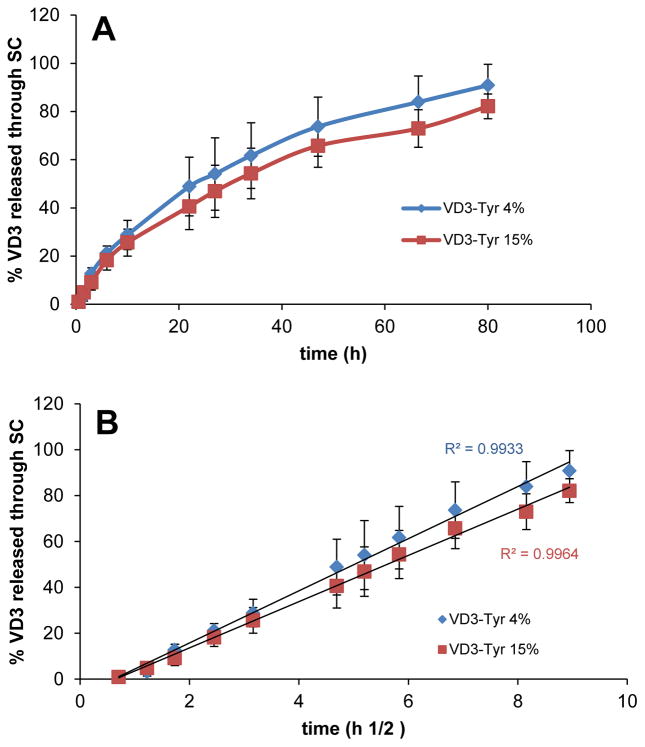
Figure 3.
Cumulative Vitamin D3 release from TyroSpheres and diffusion through stratum corneum (SC) A) as a function of time and B) as a function of the square root of time (Higuchi model). Study was done with 4 and 15 wt% initial loading VD3 in TyroSpheres (D3-Tyr). Data are shown as mean ± SD (n=5).

