Figure 2.
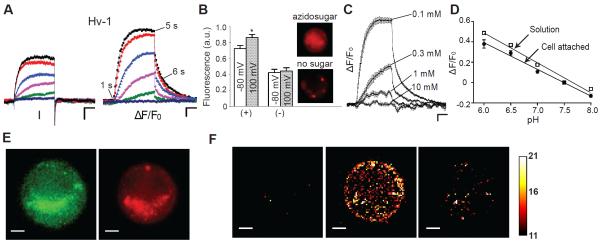
Visualization of proton efflux from CHO cells expressing Hv-1: (A) Voltage-clamp fluorometry (VCF) traces: the cell was held at − 80 mV, and currents and fluorescence were elicited from 4-s command voltages from 0 to 100 mV in 20-mV increments. (B) Average normalized fluorescence at − 80 mV and after a 4-s depolarization (100 mV) in the presence (+) or absence (−) of azidosugar. Data were averaged from 5 cells ± SEM; asterisk indicates significance of at least P < 0.05. Inset: Images of cells labeled with (top) or without (bottom) azidosugar. (C) Fluorescence traces of cells expressing similar total current (150 – 300 pA) in bath solutions with various buffer concentrations (HEPES); n = 5; error bars are ± SEM. (D) Change in pH-DIBO fluorescence attached to the cell surface (filled circles) and in a solution (open squares) versus pH. Buffer concentration 10 mM; ΔF/F0 at pH 7.5 was defined as 0; data were averaged 5 – 10 experiments ± SEM. (E) GFP and pH-DIBO fluorescence images (10 ms) of CHO cells expressing Hv-1. (F) ΔF/F0 snapshots of pH-DIBO fluorescence at 100 mV at time points indicated in (A). VCF scale bars represent 50 pA, 2% ΔF/F0, and 1 s; fluorescent image scale bars are 5 μm; pHo/pHi = 7.5/6.0; bath solution 0.1 mM HEPES except in (C and D).

