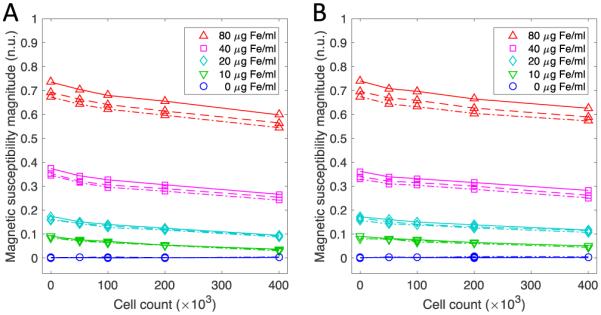
Fig 3.

Magnetic spectroscopy data from the 0.5 ml samples containing KB cells (A) and Igrov cells (B) during application of an AC field at each of the 3 frequencies (repeated line types). The magnitude data shows signal separation with respect to frequency. The frequencies shown in the figure are 900 Hz (dot dash line), 1050 Hz (solid line) and 1200 (dashed line).
