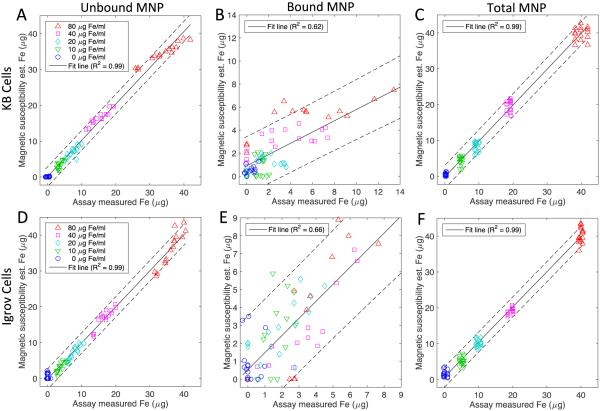
Fig 5.
To determine the generalizability of the models, cross-tests of the correspondences between magnetic spectroscopy estimates using mismatched estimation models and cell types compared to lab assay measurements of unbound (A, D), bound (B, E) and total (C, F) MNP. Models from KB cell data are tested using Igrov cell data (A, B, C) and models from Igrov data are tested using KB cell data (D, E, F). The solid line represents a linear regression between the two data sets. The dashed lines are the 95% confidence interval for the linear regression of data from 900, 1050 and 1200 Hz. In each case the line is significant (p< 0.001).

