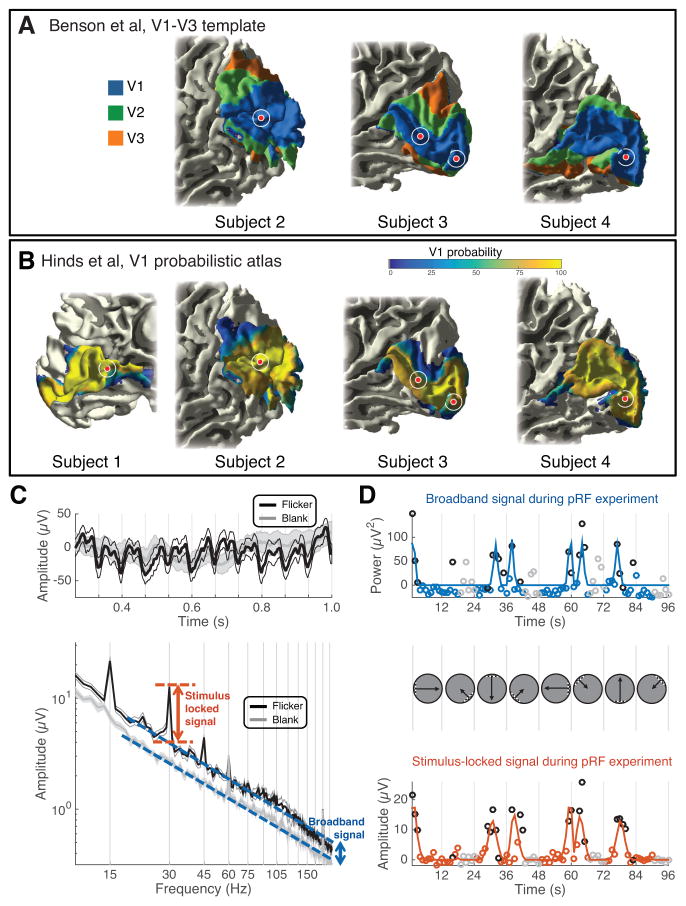
Figure 1. Electrophysiological signals in V1 electrodes.
(A–B) A template of V1-V3 (Benson et al., 2014) and a probabilistic atlas of V1 (Hinds et al., 2008) were applied to each subject’s T1-weighted anatomical MRI. The electrodes used for EBS are shown as red circles. The white circle indicates positional uncertainty of 5 mm in radius. All electrodes are within the Benson template V1 (the template failed on subject 1 due to poor alignment with the standard anatomical image in FreeSurfer) and high probability areas of the Hinds V1. (C) Mean time series (top) and power spectra (bottom) from several 1-s epochs during visual mapping experiments from an example V1 electrode (site 2). The traces show data averaged across 24 epochs when the bar stimulus was near the site’s pRF (black), or when the stimulus was blank (gray). The shaded region indicates ±1 SEM across 24 epochs. The arrows depict the stimulus locked (orange) and broadband signals (blue). (D) The 96-s experiment was summarized with two time series, broadband (upper) and stimulus-locked (lower). The trajectory of the bar apertures is shown between the upper and lower plots. Blue and orange lines are pRF model fits to the data, and circles are the data (either broadband or stimulus locked measurement from each epoch). Black and gray circles indicate the 24 epochs summarized in panel C (flicker and blank, respectively). See Figure S1, Table S1.

