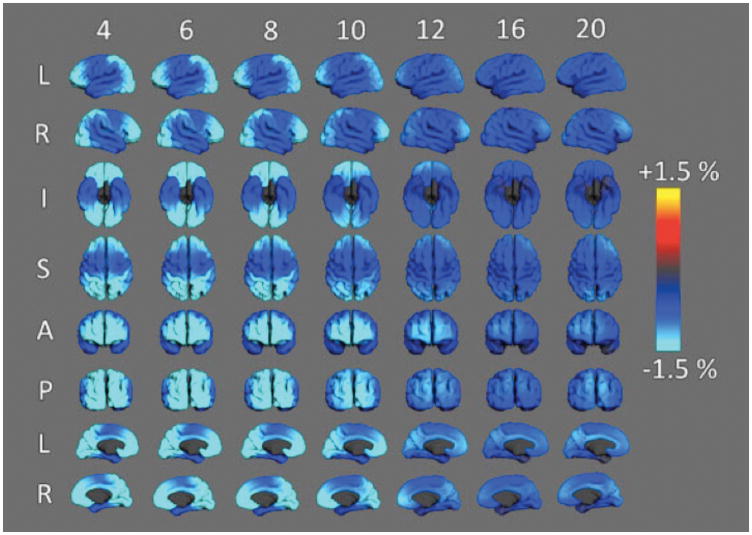
Figure 9.
Annualized rate of apparent thinning of the cortex on MRI. Maps above show different views of the cerebral cortex and the color codes for the estimated rate of thinning. Note that in some areas of the cortex of 4–10 year olds, the cortex appears to think at a rate above 1.5% per year. In older children age-related thinning continues but at a more modest rate. Measured in the PING sample and described in Jernigan et al., 2015 26.

