
Figure 1.
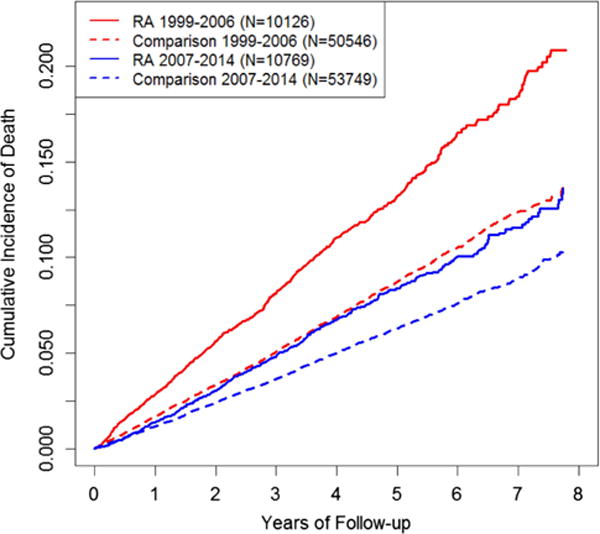
Graph showing the cumulative mortality of patients with rheumatoid arthritis (RA) and corresponding individuals without RA in early versus late cohorts (1999–2006 vs 2007–2014, respectively).
Official websites use .gov
A
.gov website belongs to an official
government organization in the United States.
Secure .gov websites use HTTPS
A lock (
) or https:// means you've safely
connected to the .gov website. Share sensitive
information only on official, secure websites.
Graph showing the cumulative mortality of patients with rheumatoid arthritis (RA) and corresponding individuals without RA in early versus late cohorts (1999–2006 vs 2007–2014, respectively).