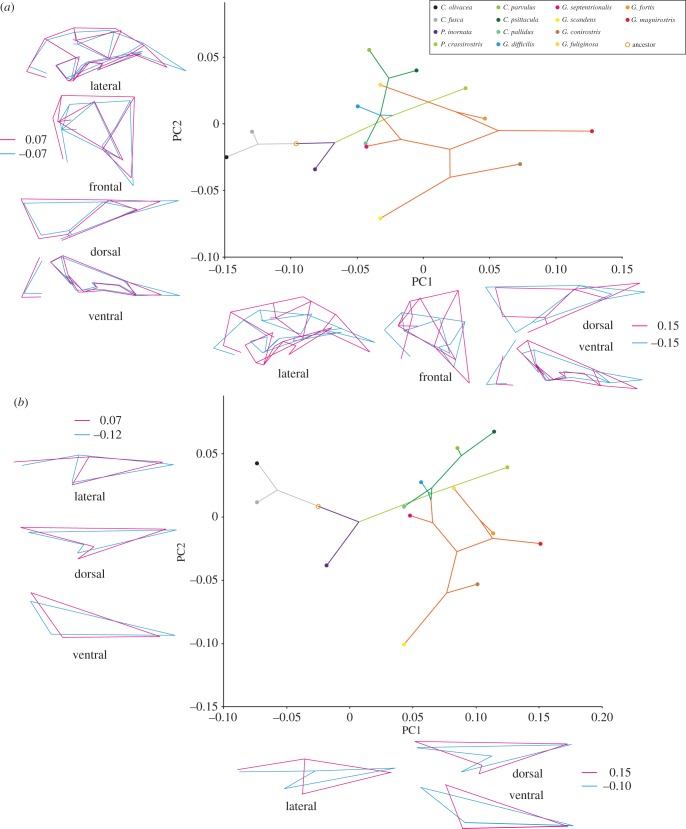
Figure 5.
Phylomorphospace of the whole skull and upper beak of Darwin's finch species made using principal components analysis. (a) The whole skull (tree length: 0.044; p-value: 0.005) and (b) the upper beak (tree length: 0.033; p-value: <0.0001). PC scores for the mean shape of each species were mapped to the phylogenetic tree from figure 1, using unweighted squared-change parsimony.

