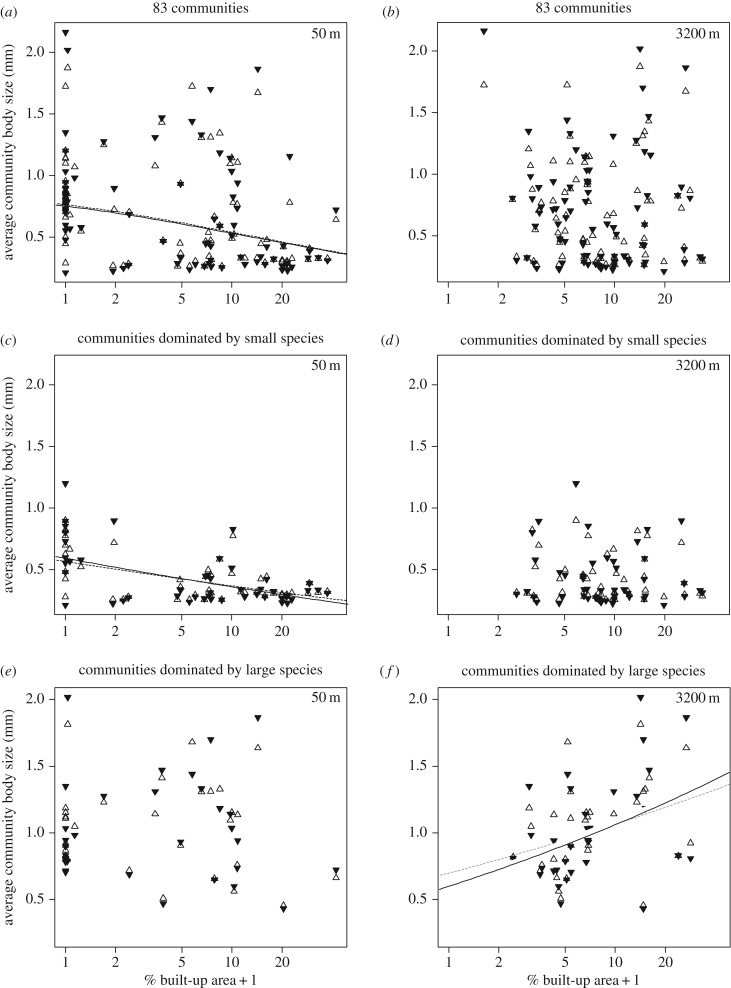
Figure 1.
Relationships between body size variation and percentage built-up area (%BA + 1, plotted on a log-scale) among the 83 communities (a,b), the subset of communities dominated by small species (n = 49; c,d) and the subset of communities dominated by large species (n = 32; e,f), where average community body size is calculated using the local trait values of the species (filled triangles) and using the metacommunity-wide species trait values (unfilled triangles). Results are given for urbanization assessed at the local (50 m; a,c,e) and regional (3200 m; b,d,f) spatial scale. Significant relationships (p < 0.05) between body size variation and percentage built-up area for the community body sizes calculated using the local and metacommunity-wide species trait values are shown by black solid and dashed lines, respectively. p < 0.1 are shown in grey lines. p-values are given in electronic supplementary material, table SA5.

