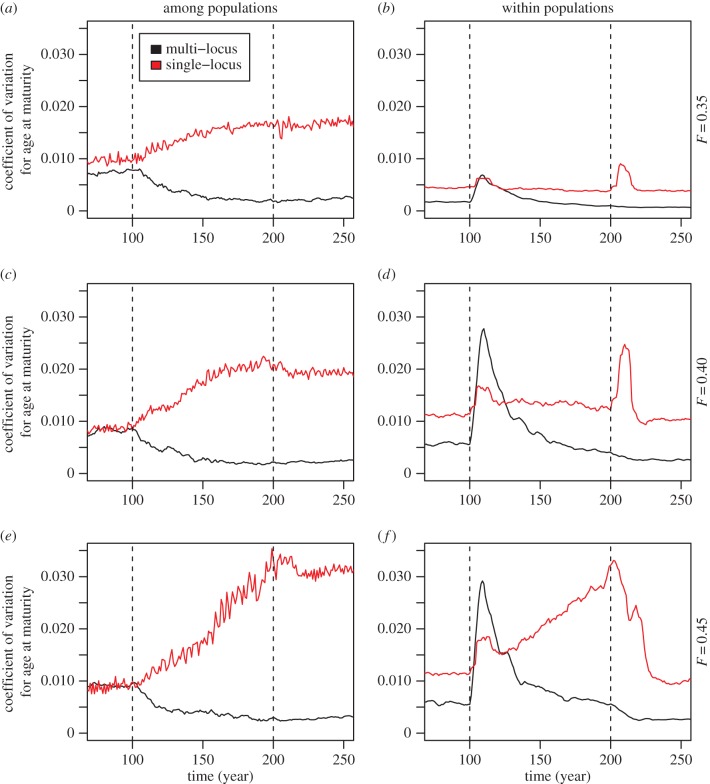
Figure 3.
Coefficients of variation (CV) for age at maturity across the progress of simulations. CVs are calculated both among simulated populations (i.e. simulation runs; a,c,e) and within populations (i.e. runs; b,d,f). Within-run CV is calculated at each time point across the previous 10 years. Simulations illustrating single-locus control of the trait are in red and those illustrating multi-locus control in black. Alternative fishing mortalities (F) are indicated at the right of each row; the beginning and end of the fishing period are indicated by dashed vertical lines. (Online version in colour.)

