
Figure 3.
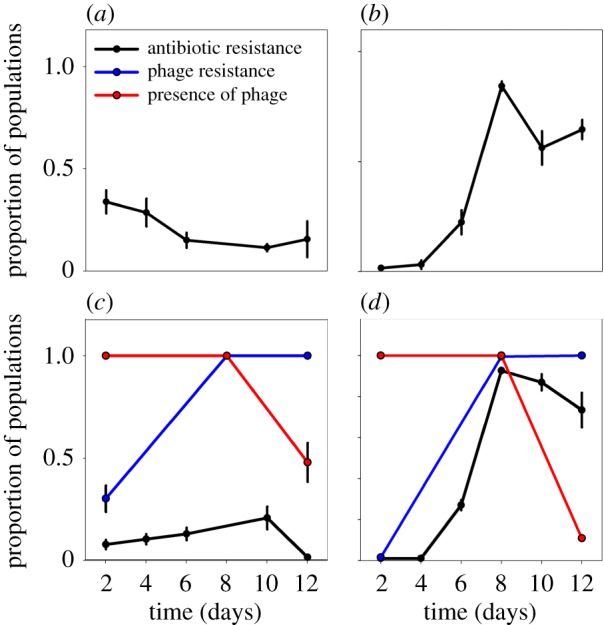
Proportion of Sm and phage resistant populations out of a total of 48 populations per replicate, as well as proportion of populations containing phage Φ2, during 12-day experiment (mean ± s.e., n = 4). (a) The 0 µg ml–1 Sm environment without phage. (b) The 2 µg ml–1 Sm environment without phage. (c) The 0 µg ml–1 Sm environment with phage. (d) The 2 µg ml–1 Sm environment with phage. Phage (red lines), phage resistance (blue lines) and antibiotic resistance (black lines) are differentiated by line colour.