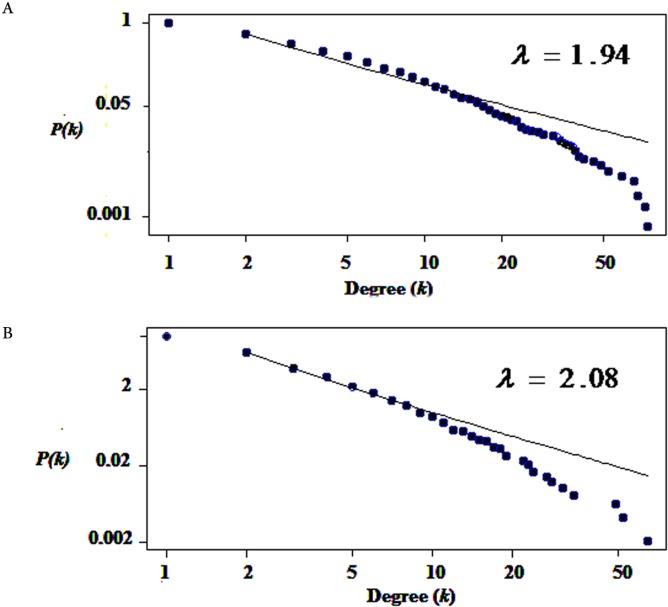
Figure 1. The degree distribution of nodes followed power law distribution.
(A) Degree distribution of differentially expressed genes in CSF QQPPI network. (B) PBMCs QQPPI network. The graph represents a decreasing trend of degree distribution with an increase in the number of links showing scale-free topology.

