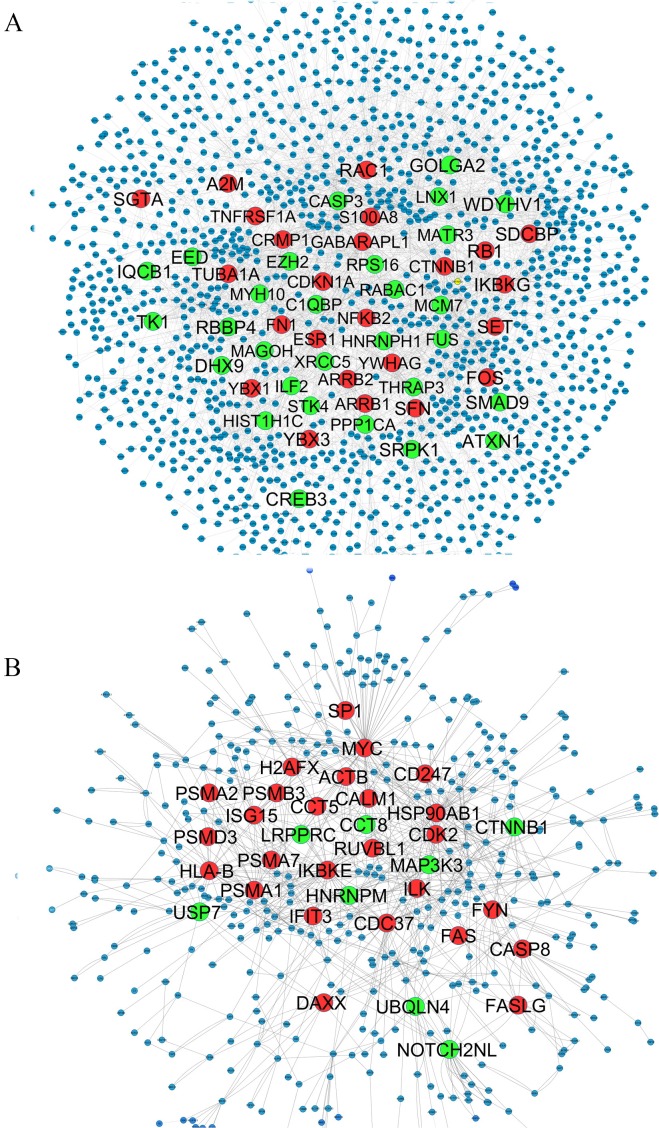
Figure 2. QQPPI networks generation by mapping of differentially expression genes on PPI data.
(A) CSF QQPPI network. (B) PBMCs QQPPI network. Nodes with high centrality measures are shown by bigger size than others. Green and red nodes represent proteins encoded by up- and down-regulated genes, respectively. Graphical representation of nodes was implemented by “Spring Embedded” layout in Cystoscape.

