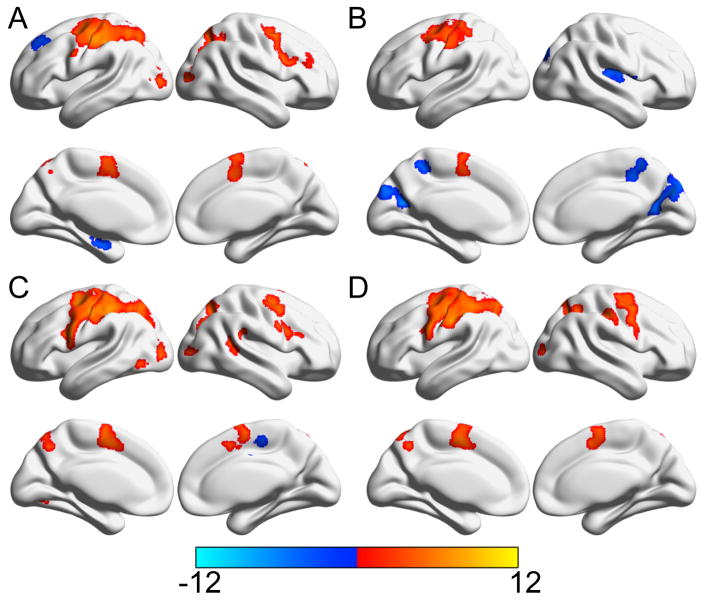
Figure 4.
Areas significantly activated during the first (A) and second (B) halves of the learning blocks as well as the first (C) and second (D) halves of the control blocks. Color bar indicates the t-statistic from one-sample t-tests (tested whether the control and learning blocks from the first/second halves were significantly greater than zero). Areas significantly positively associated with the task regressor are in red while those negatively associated are shown in blue.

