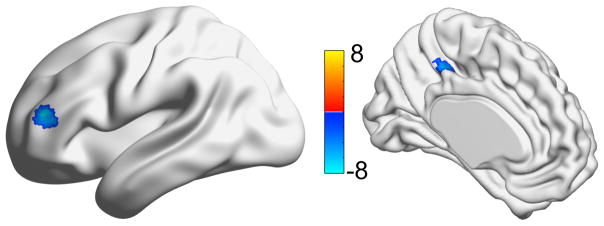
Figure 5.
Regions where the differences between the gPPI interaction terms are significantly different. Color bar indicates the t-statistic from a one-sample t-test (testing whether the learning compared to control gPPI interaction terms was significantly greater than zero). Blue shows regions where the interaction term was greater in the control compared to the learning, while red shows the opposite (none).

