Fig. 3.
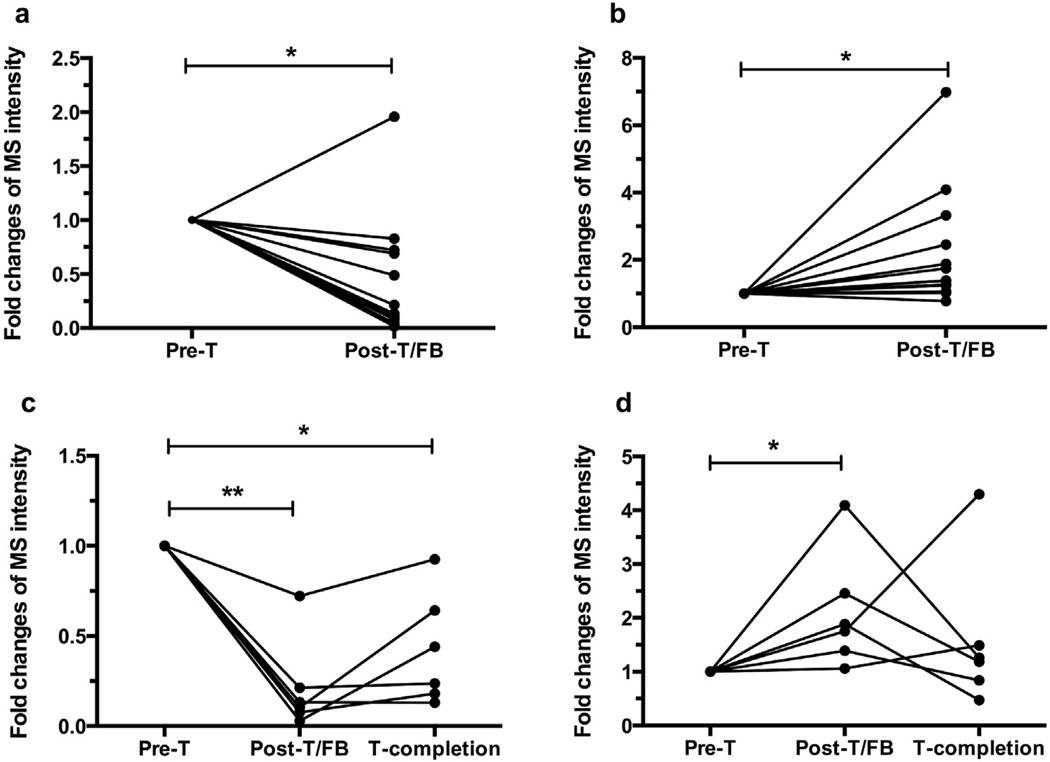
Serum BK and DABK changes in response to anti-TB treatment. (a) BK declined and (b) DABK increased at earlier stage in 13 patients (data were analyzed based on the first blood draw after treatment. It can be time points either at sputum culture conversion or after induction phase; patient 9 was included as they had only 2 sampling times). Six patients (No. 5–7 and 10–12) had serum samples through treatment completion. These 6 patients revealed that (c) BK declined and tended to remain low after treatment initiation while (d) also showing a significant increase in DABK after induction phase and a tendency for a DABK decline at treatment completion, which did not significantly differ between induction phase and treatment completion. *p < 0.05, **p < 0.001. Pre-T: pre-treatment; Post-T/FB: post-treatment (first blood draw); T-completion: treatment completion.

