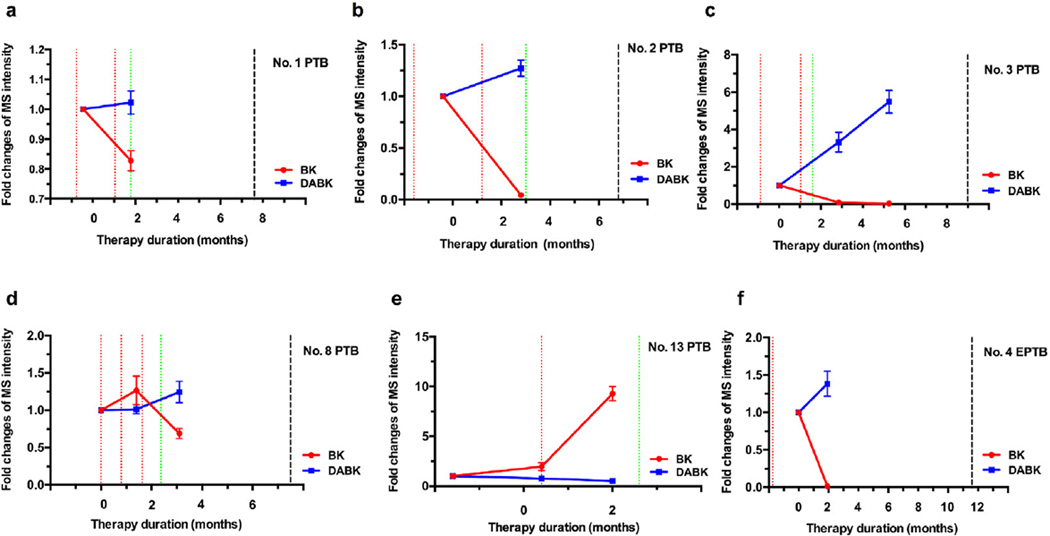
Fig. 4.
Changes in serum BK and DABK during the induction phase of TB therapy. BK decreases and DABK increases corresponded with the SCC of TB patient (a–d). One patient showed elevated bradykinin with modest change of DABK before SCC and was lost to follow up (e). The EPTB patient (patient 4) exhibited reduced BK and increased DABK at 2-month post treatment (f). Red line: positive sputum culture; Green line: negative sputum culture; Black line: end of treatment; The EPTB patient had an initial positive Mtb culture from a biopsy specimen. (For interpretation of the references to colour in this figure legend, the reader is referred to the web version of this article.)

