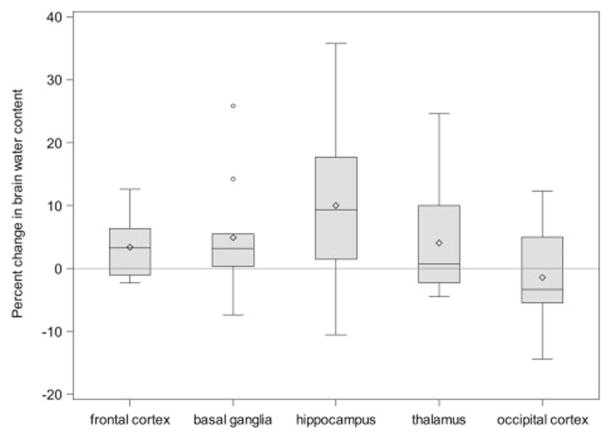
Figure 2.
Differences in brain water content measurements during DKA compared with post-recovery (n=10), expressed as percent changes. The line in the middle of each box indicates the median (50% percentile), the top and bottom indicate the 75th / 25th percentiles, the diamond indicates the mean. The whiskers extend toward the maximum and minimum values to a maximum length of 1.5 interquartile ranges. Individual values beyond the whiskers are possible outliers. For imputed values, the depicted value is based on the geometric mean treatment to recovery ratio across the 100 multiple imputation datasets.
| GMR (95% CI) | RGMR (95% CI), Relative to Occipital Cortex | |
|---|---|---|
| Frontal cortex | 1.03 (0.999, 1.07) | 1.05 (0.99, 1.12) |
| Basal ganglia | 1.05 (0.99, 1.11) | 1.06 (0.99, 1.14) |
| Hippocampus | 1.09 (0.90, 1.32) | 1.11 (0.92, 1.34) |
| Thalamus | 1.04 (0.98, 1.10) | 1.06 (0.98, 1.14) |
| Occipital cortex | 0.98 (0.92, 1.05) | Reference |
Pooled estimates from 100 multiple imputation datasets.

