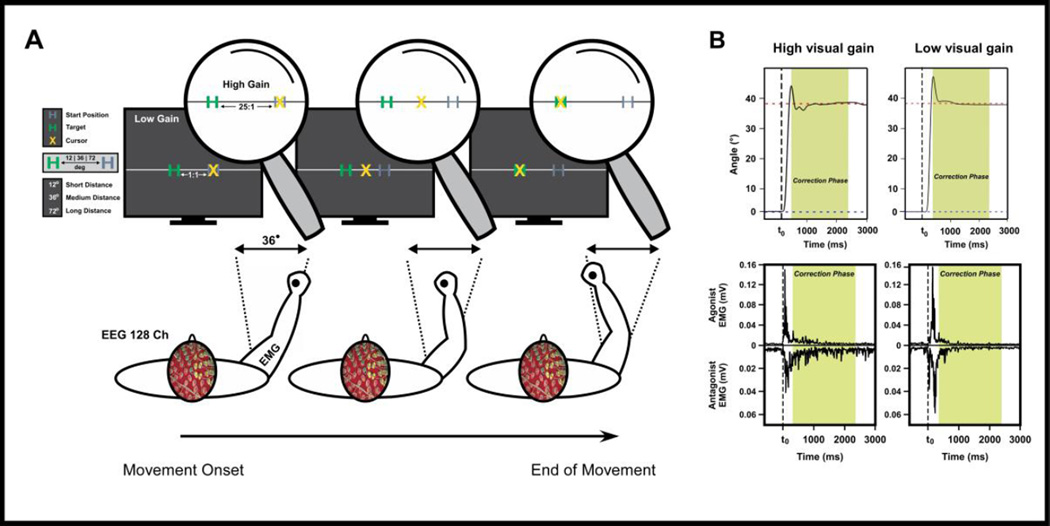
Figure 1. Experimental setup, and illustration of kinematic and neuromuscular data.
Schematic representation of the desired body configuration (transverse plane) during various phases of the movement (A). We illustrate the visual feedback displayed on the monitor for the 36° angular distance condition. The gray H character on the monitor indicates the start position, the green H character indicates the target position, and the yellow X character indicates the angular position of the participant’s arm. Section B shows angular position data, agonist, and antagonist EMG time series data for high and low visual gain conditions from one subject. The green shaded area indicates the post ballistic movement (PBM) phase.

