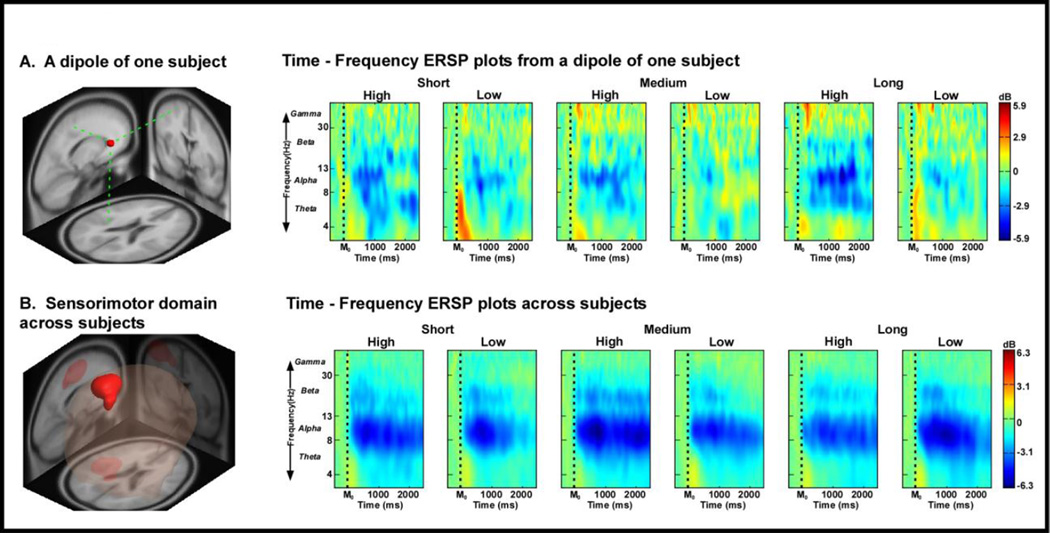
Figure 3. ERSP time-frequency plots within the sensorimotor domain.
ERSP time-frequency plot from a dipole located in the sensorimotor area for one subject (A), and ERSP time-frequency plots for high and low visual gain conditions across all 16 subjects (B). The x-axis denotes time with M0 representing movement onset. The logarithmic y-axis depicts frequencies from 3 to 50 with the major EEG bands, theta, alpha, beta, and gamma labeled. The ERSP plots are color coded based on decibel where positive values are warm colors and negative values are cool colors.

