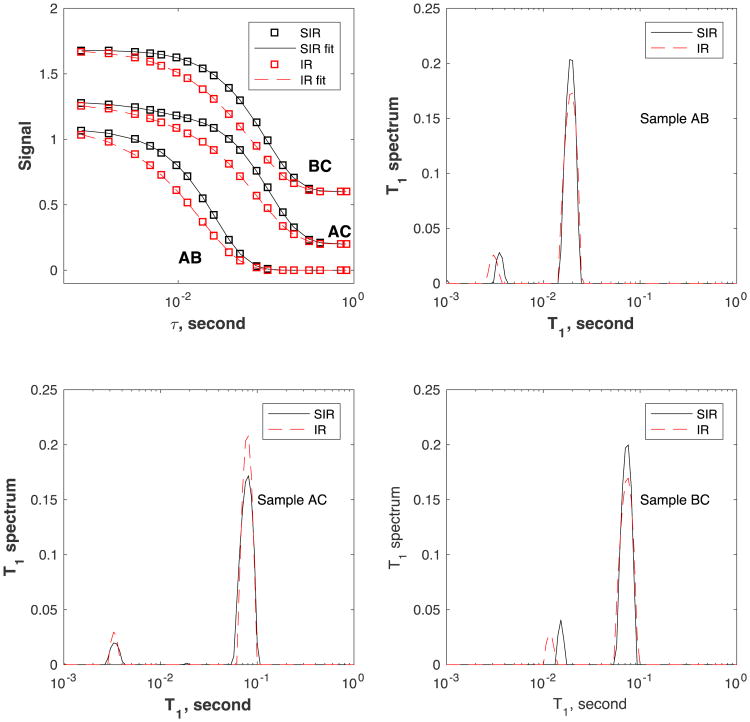
Figure 7.
Signal decay curves S(τ = ∞) – S(τ) (top-left panel, SIR: black circles, IR: red squares) and corresponding T1 spectra (right and bottom panels, SIR: solid line, IR: dotted line) for the mixed samples AB, AC, and BC. The lines in the top-left panel are fitting results using the Fast Laplace inversion algorithm [18]. The data for samples AC and BC in the top-left panel are shifted upward for clarity.

