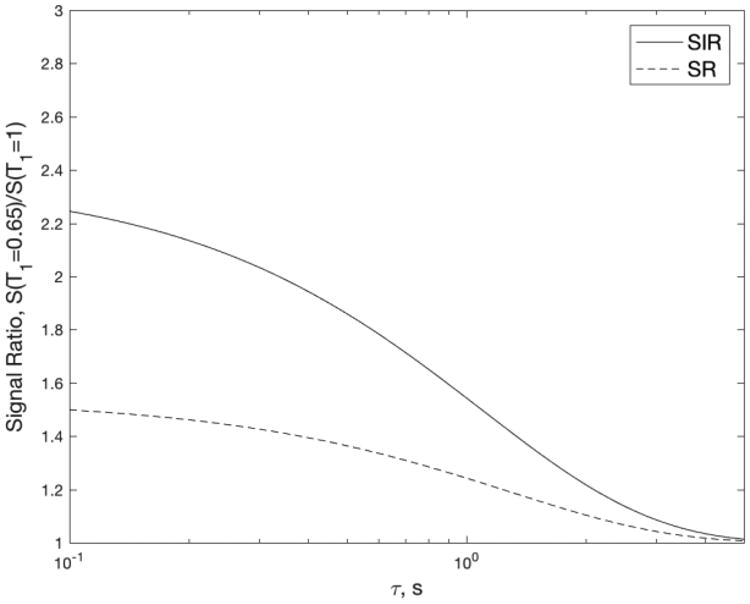
Figure 8.

Ratio of signals with T1 = 0.65 s and 1 s as a function of the recovery time τ for SIR (solid line) and SR (dashed line) sequences. The higher value for SIR shows an improved contrast between the different T1 values. For example, at τ = 0.65 s, SIR achieves more than twice the contrast (defined as normalized signal ratio less unity) of SR.
