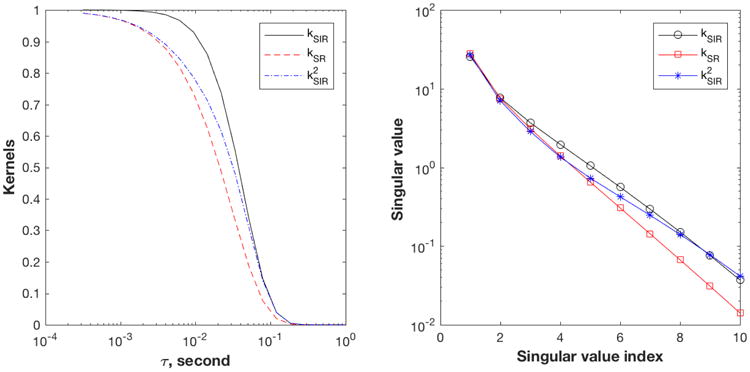
Figure 9.

Comparison of kernels of SIR family sequences. SIR (solid line), SR (red dashed line) and SIR2 (blue dash-dotted line). Left: Signal decay curves for T1 = 0.03 s for the three sequences. Right: Plot of the singular values of the three kernels. The kernel matrices are evaluated as K(τ, T1) with 20 τ values from 0.3-1000 ms, and 100 T1 values from 1-1000 ms. SVD is calculated using MATLAB (Mathworks, Natick MA).
