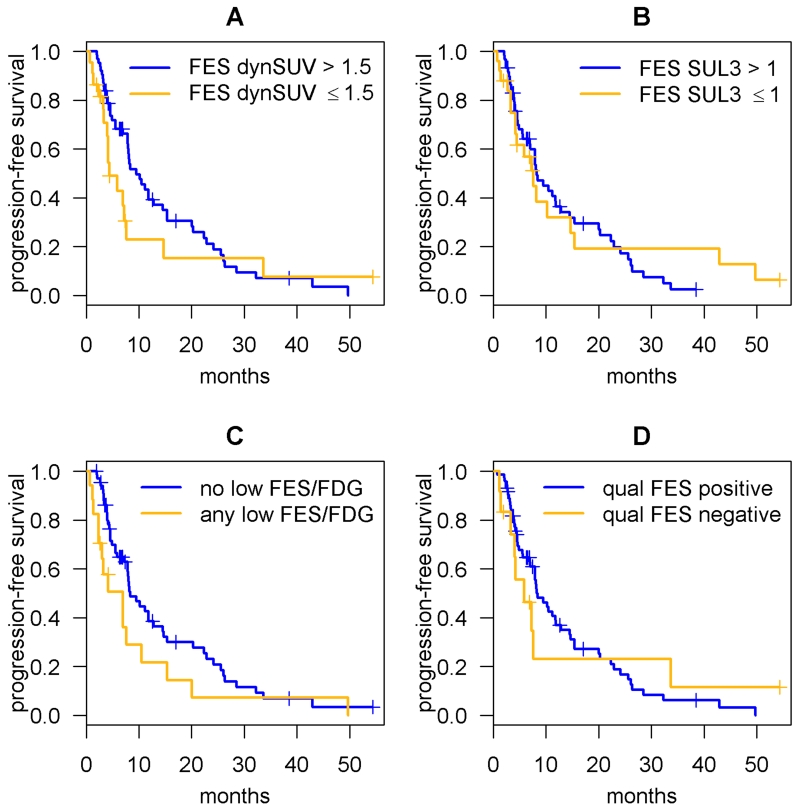
Figure 1.
Kaplan-Meier curves of progression-free survival (PFS) for prespecified quantitative imaging classifiers predicting endocrine response (N=84, p>0.05 for all). A. FES dynSUV = average of FES SUVmean of up to 3 lesions in the dynamic field-of-view B. FES SUL3 = geometric mean of FES SULmean (lean-body-mass adjusted FES SUVmean) for up to 3 lesions in torso sweep with highest FDG SUVmax C. any low FES/FDG = presence of any lesion with FES SULmean < 1 and FDG SUVmax > 5 D. qualitative FES neg = presence of any lesion lacking FES uptake above background (qualitative read).

