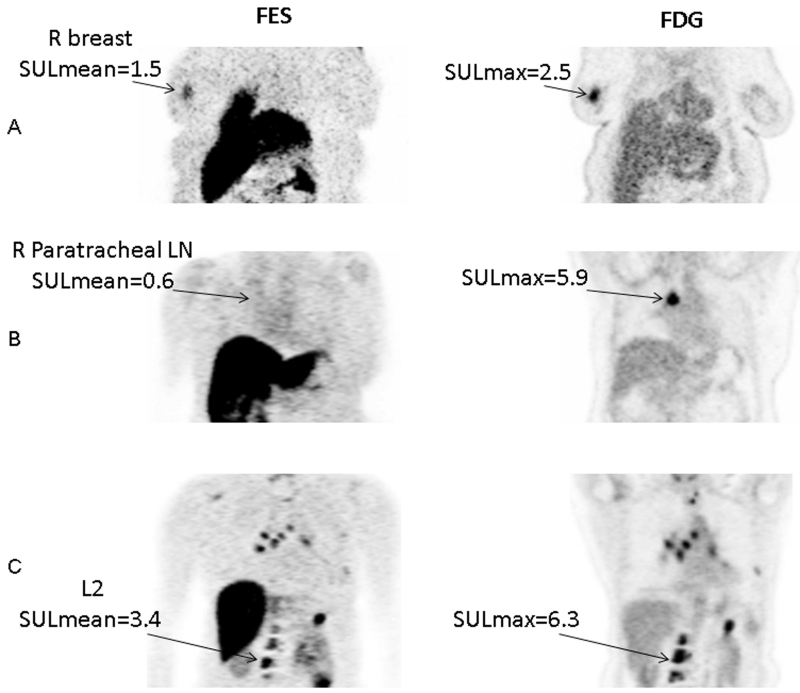
Figure 3.
Representative cases for the three classification groups in Table 3 and Figure 2. Coronal view from FES PET and FDG PET scans. Ordered-subset expectation maximization (OSEM) reconstruction was used for improved presentation, but not for quantitation. A. low FDG SULmax3. This 56-yo woman had 4 lesions in her breast and lymph nodes. Geometric mean FDG SULmax for the 3 hottest lesions was 1.5. (Geometric mean FES SULmean was 1.1.) She was on anastrozole for 5 months until progression. B. high FDG SULmax3 and low FES SULmean3. This 59-yo woman had 5 lesions in lymph nodes and spine. Geometric mean FDG SULmax for the 3 hottest lesions was 4.4. Geometric mean FES SULmean3 was 0.3. She was on tamoxifen for 3 months until progression. C. high FDG SULmax3 and high FES SULmean3. This 59-yo woman had lesions in the breast, chest wall, and hilar nodes, as well as multiple bony lesions. Geometric mean FDG SULmax for the 3 hottest lesions was 12.7. Geometric mean FES SULmean was 6.6. She was on exemestane for 9.5 months until progression.

