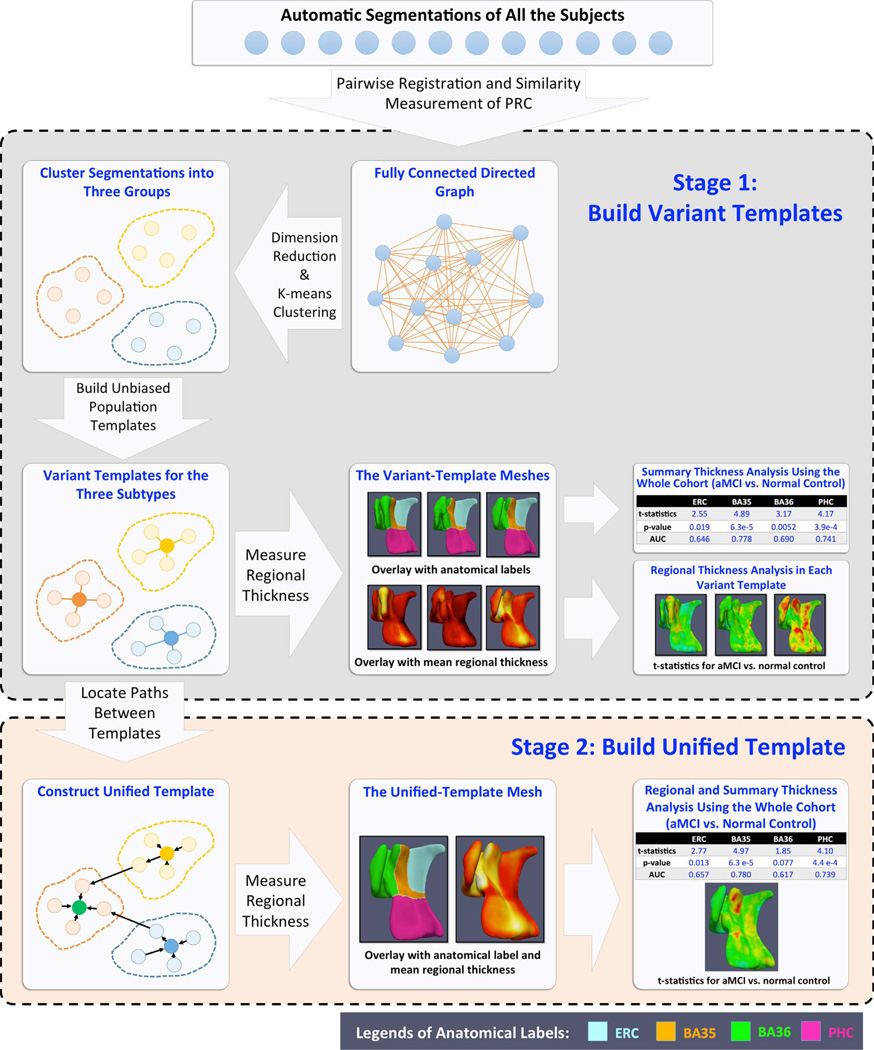
Fig. 4.
Schematic flowchart of the proposed multi-template thickness analysis pipeline. The proposed pipeline takes label maps from ASHS as inputs. At the first stage (top block), subjects are automatically clustered into three groups. A separate “variant template” is generated for each group. At this stage, regional thickness analysis can only be performed within subjects sharing the same anatomical variant, while summary thickness analysis can be performed using the whole cohort. At the second stage (bottom block), by locating the intermediate subjects linking the variant templates, pointwise correspondences are established between them, and a unified template is generated. This allows both regional and summary thickness analyses using all the subjects.

