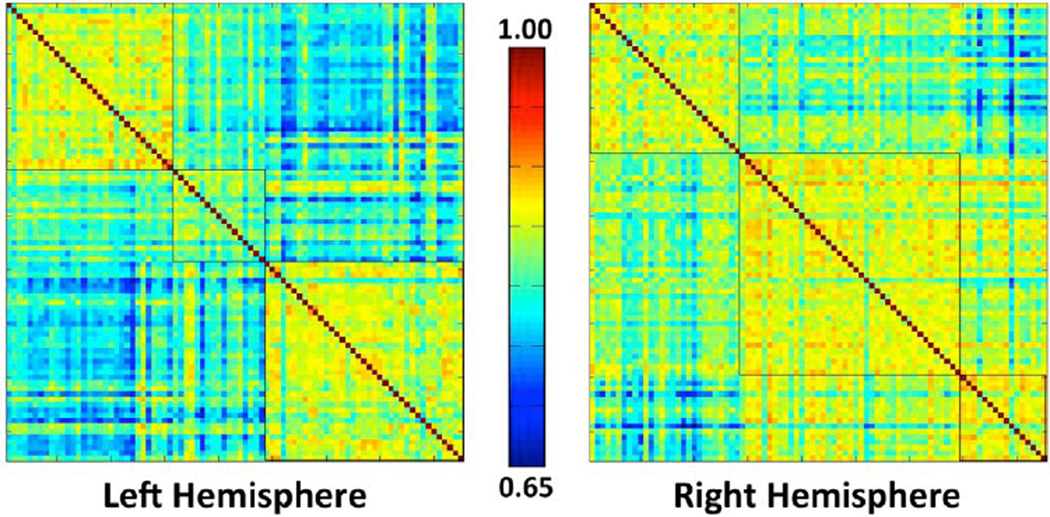
Fig. 6.
The pairwise PRC similarity matrices of both hemispheres. The subjects are reorganized so that those belong to the same cluster are put together. Black contours outline the three clusters generated using probabilistic principal component analysis (PPCA) and k-means algorithm. The number of subjects at each cluster is summarized in Table 2.

