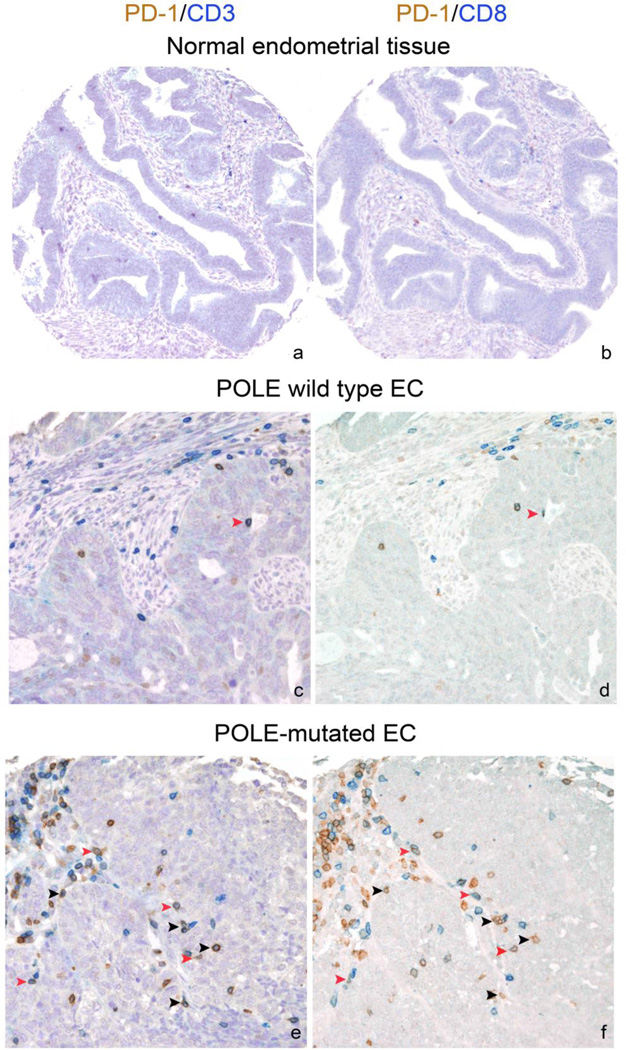
Figure 2.
Representative photomicrographs of double immunostaining for PD-1 (brown) and CD3 (blue) (a,c,e) and for PD-1 (brown) and CD8 (blue) (b,d,f) on TMA sequential sections from representative FFPE normal endometrial tissues (a–b), POLE wild type (c–d) and POLE-mutated (e–f) EC cases. TILs are generally scant in POLE wild type but significantly increased in POLE-mutated tumors. Black arrowheads indicate PD-1+CD3+CD8-cells (inferred PD-1+CD4+); red arrowheads indicate PD-1+CD3+CD8+ cells. Sections are counterstained with Meyer’s haematoxylin. Original magnifications: 100× (a–b); 400× (c–f).

