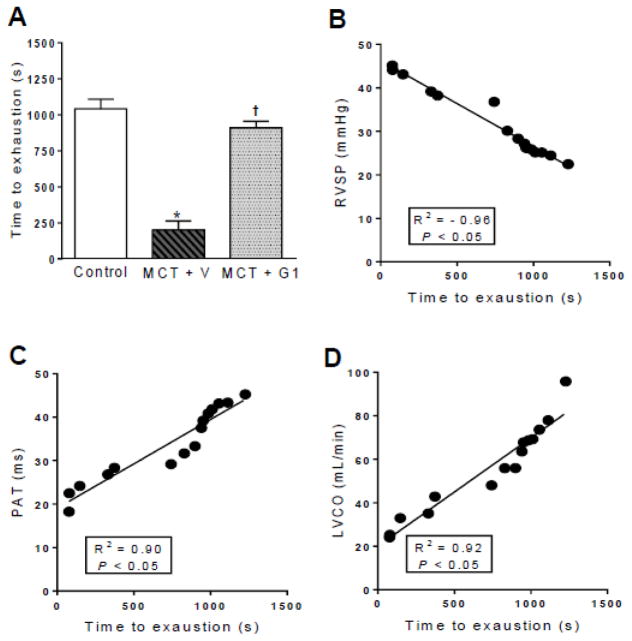
Figure 5.
Effects of the subcutaneous treatment with vehicle or G1 (400 μg/kg/day) on exercise test protocol of MCT-injected rats. a time to exhaustion, b linear regression between RVSP and time to exhaustion, c linear regression between PAT and time to exhaustion, and d linear regression between LVCO and time to exhaustion 29 days after monocrotaline injection. Each column and bar represent the mean ± S.E.M. (n = 5 rats per group). *P < 0.05 compared with control rats; †P < 0.05 compared with MCT + vehicle rats. RVSP, right ventricular systolic pressure; PAT, pulmonary artery acceleration time, LVCO, left ventricular cardiac output, MCT, monocrotaline; V, vehicle.

