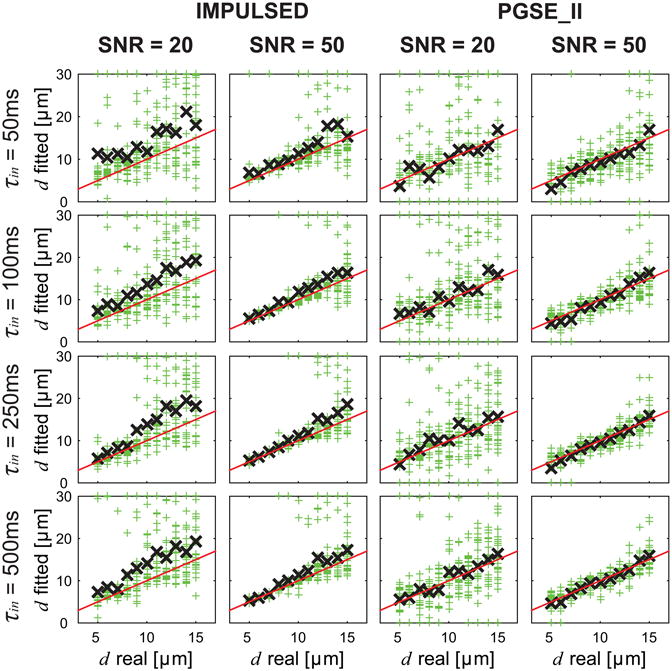
Figure 3.

Simulated influence of SNR on fitted d using the IMPULSED and PGSE_II methods. For each real d, the fittings were repeated 100 times (green +) each with different noises but at the same SNR level, and the mean of the repetitions (black ×) are also shown. The red lines represent the identity lines.
