
Figure 5.
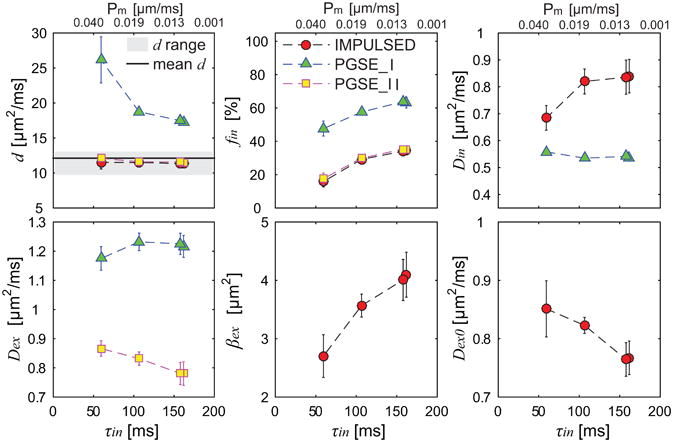
Summary of fitted microstructural parameters vs τin using three diffusion methods. Error bars in each sub-figure denote across-sample STD. d range means histology-derived mean cell diameter ± STD of all cells, and mean d is volume-weighted cell diameter.