
Figure 1.
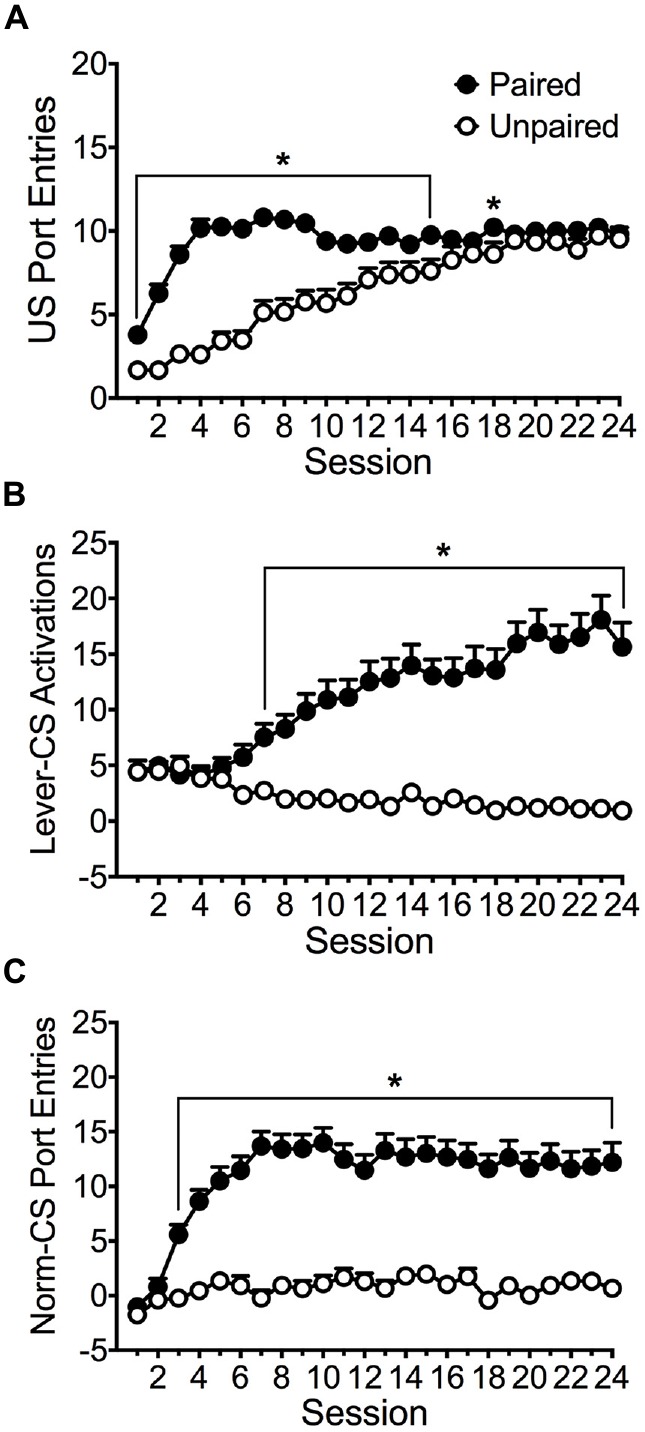
Acquisition of responses across 24 Pavlovian autoshaping sessions. Average (± SEM) (A) port entries made during the 6 s interval when the alcohol unconditioned stimulus (US) was delivered into the fluid port, (B) activation of the lever-CS during 10 s lever-CS trials, and (C) normalized entries into the fluid port during 10 s lever-CS trials. Data are normalized by subtracting port entries during 10 s intervals immediately before each CS from port entries during each CS. Black symbols represent the paired group (n = 76) and white symbols represent the unpaired group (n = 31). *p < 0.05, Bonferroni-corrected comparisons between paired and unpaired groups in each session.