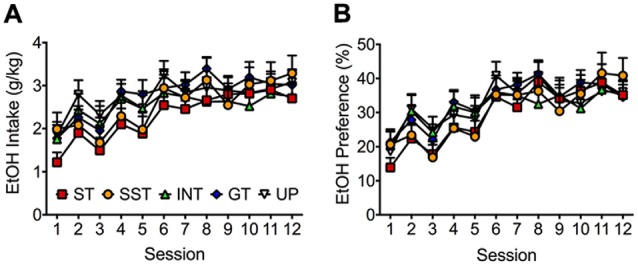
Figure 3.

Alcohol intake and preference increased for all phenotypes across 12 sessions of 15% alcohol exposure in the home-cage. Average (± SEM) of (A) alcohol intake (g/kg) and (B) alcohol preference (%; grams of ethanol solution consumed divided by total fluid consumed) for paired rats categorized as sign-trackers (red; n = 19), shifted sign-trackers (yellow; n = 13), intermediates (green; n = 16) or goal-trackers (blue; n = 28), and unpaired rats (white; n = 31).
