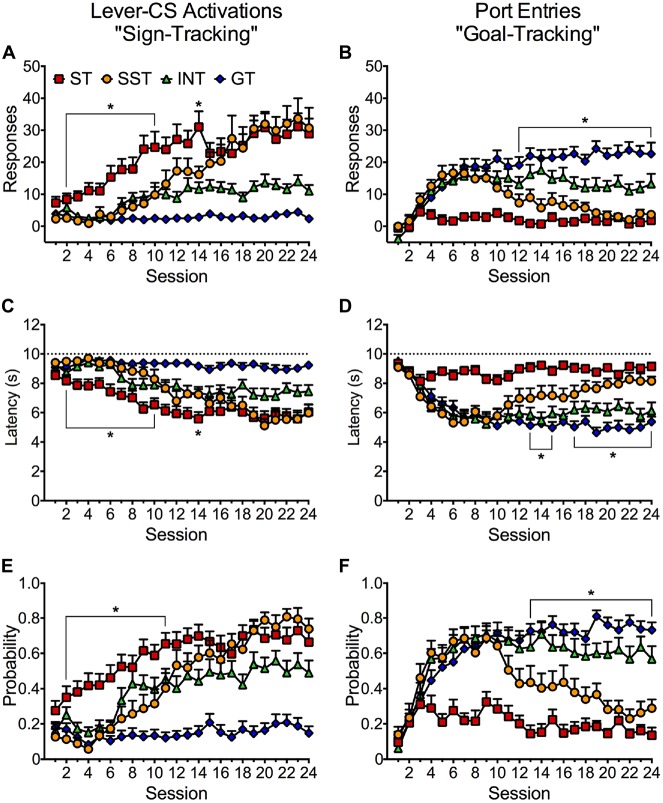
Figure 5.
Conditioned approach responses elicited by the lever-CS in four identified phenotypes across 24 sessions. Data are expressed as average (± SEM) (A) lever-CS activations, (B) normalized port entries during lever-CS trials, (C) lever-CS activation latency, (D) CS elicited port entry latency, (E) probability to activate the lever-CS and (F) probability to make a port entry during a lever-CS trial. Dashed lines in (C,D) indicate the maximum latency to make a response or recorded latency if no response was made. *p < 0.05, Bonferroni-corrected comparisons of shifted sign-trackers relative to sign-trackers (A,C,E) and relative to goal-trackers (B,D,F) in each session.

