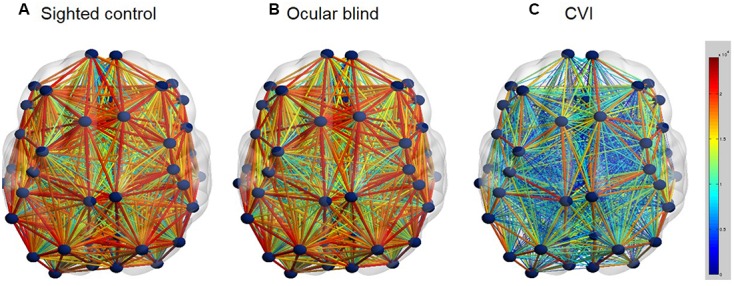
FIGURE 2.

Whole brain structural connectivity (ball and stick models; axial view) for the group averages of normally developed sighted controls (A), ocular blind (B), CVI individuals (C). White matter connectivity across the entire cortex was assessed using HARDI tractography. The number of reconstructed fibers between each of the 68 cortical regions (parcellated using the Desikan atlas; Desikan et al., 2006)) was used as a proxy for connection strength. Similar to the data shown in Figure 1, connections between each region were reconstructed in DSI-Studio. Once whole brain connectivity matrices were acquired for all subjects, they were averaged within subject groups and visualizations were rendered using BrainNetViewer (Xia et al., 2013). Each brain region is represented by a dark blue sphere, while the connection strength (i.e., number of reconstructed connections) between each region is represented by the color and diameter of the lines. Thus, a thick red line characterizes strong connections with abundant white matter fibers, while a thin blue line characterizes weak connections with minimal white matter fibers. Note the striking reduction in global structural connectivity that occurs in CVI, compared to both the control and ocular blind individuals [Figure adapted from Bauer et al. (2014a)].
