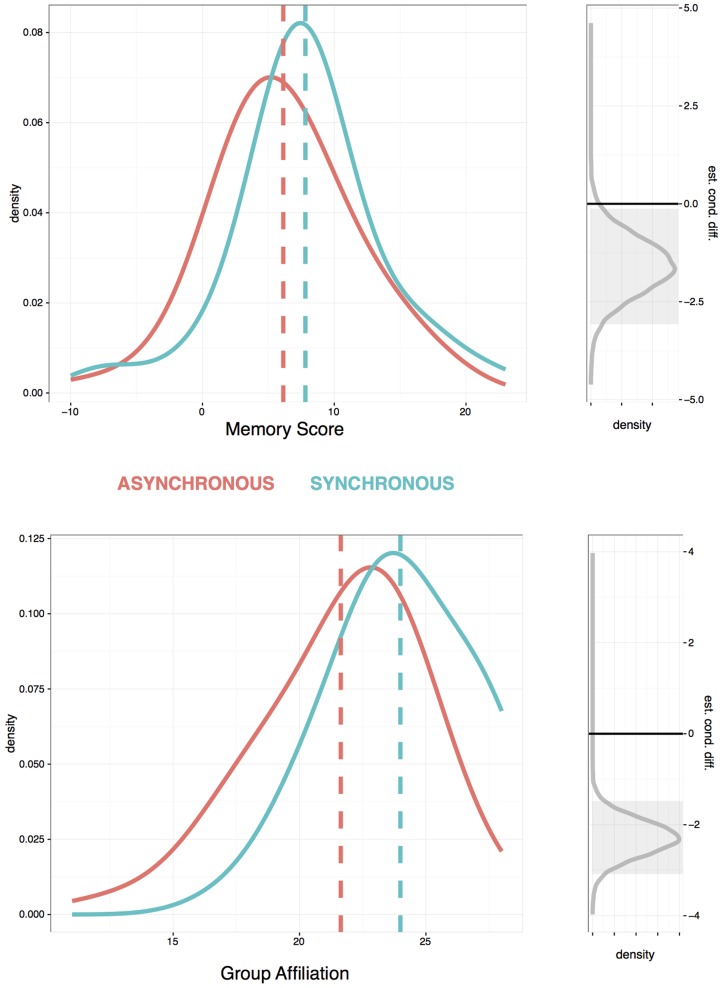
FIGURE 3.
Participants’ scores on memory for words (top) and group affiliation ratings (bottom). Red and blue lines show the distribution of scores in the asynchronous and synchronous chanting conditions. Gray lines show the Bayesian estimate of distribution of the difference between conditions and gray areas show their 95% credibility intervals.

