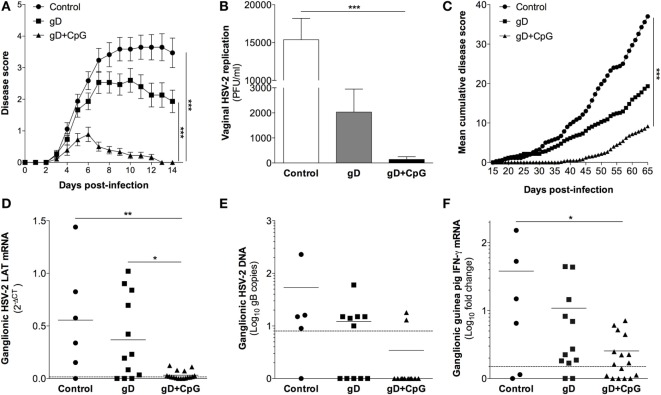
Figure 1.
Nasal immunization in guinea pigs mounts protective immunity to primary genital herpes, establishment of viral latency and recurrent outbreaks. Groups of female guinea pigs were immunized nasally with gD alone or together with CpG three times with 14 days interval. A control group given the diluent PBS was also included. Four weeks following the last immunization guinea pigs (n = 15–18) were challenged vaginally with 2 × 10⁵ plaque forming units (PFU) of HSV-2, thereafter monitored daily for symptoms of disease. The guinea pigs surviving primary infection (n = 7–18) were continued to be monitored daily for up to day 65 post-challenge for symptoms of recurrent outbreaks. At day 65–70 post-infection, ganglia were isolated from the animals and RNA was purified alone or co-purified with DNA from the ganglia, and the levels of mRNA and DNA were determined by real-time PCR. (A) Disease progression during primary HSV-2 infection (day 0–14 post-challenge). Disease symptoms scored as 0 = healthy, 1 = swelling and/or genital erythema, 2 = a few small vesicles, 3 = several confluent ulcerated vesicles, 4 = ulcerated lesions, purulent inflammation, incontinence, and 5 = large disseminated lesions, severe weight loss, neurological symptoms. Guinea pigs were euthanized as soon as displaying severe signs of illness (score 5). (B) The level of vaginal HSV-2 titers on day 3 post-challenge displayed as PFU/ml. (C) Disease progression during latent HSV-2 infection (day 15–65 post-challenge) shown as mean cumulative disease score over time (n = 7–18). (D) RNA extracted from ganglia (n = 6–17) was quantified by real-time PCR with primers specific for HSV-2 LAT. The results are shown as 2−δCT of LAT. (E) Viral DNA copies in ganglia shown as the number of HSV-2 genome copies per 100 ng DNA (n = 5–12). (F) IFN-γ transcript in dorsal root ganglia (DRG) (n = 6–17) expressed as fold change over the mean expression in naïve guinea pigs. The dotted line in (D–F) displays the detection threshold. Results in (A,B) are expressed as the mean ± SEM. The end points in (A,C) as well as the data in (B) and (D–F) were analyzed by one-way ANOVA followed by Tukey multiple comparison test (CI 95%), with differences statistically significant at p values of <0.05 (*), <0.01 (**), and <0.001 (***).

