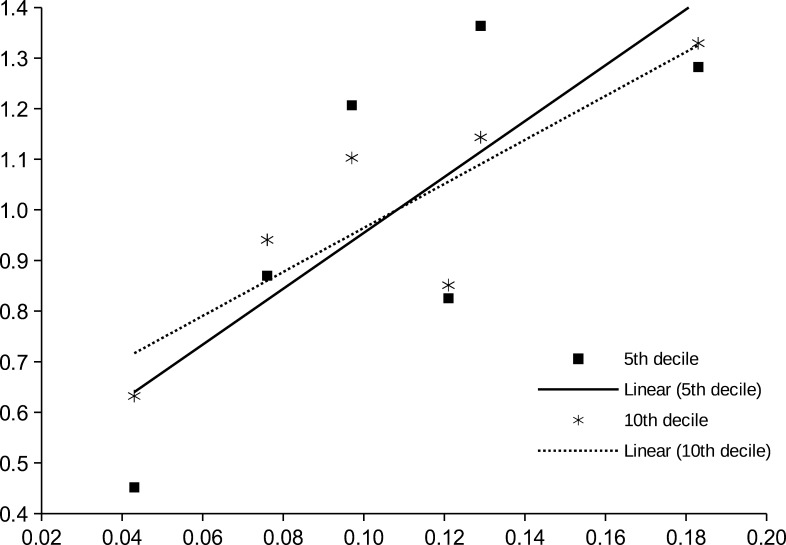
Figure 3.
The correlation of histone enrichment in specific positions with the average histone content of samples. Dots – individual samples. Lines – linear regression lines. Only 5th and 10th deciles by cumulative enrichment are shown. Deciles are calculated by different samples than regression values. The higher slope of the regression line of the 5th decile indicates that in these regions the enrichment is more strongly correlated with the histone content. X-axis – histone content (sequencing coverage) of sample. Y-axis – the average normalized enrichment in given decile.

 This work is licensed under a