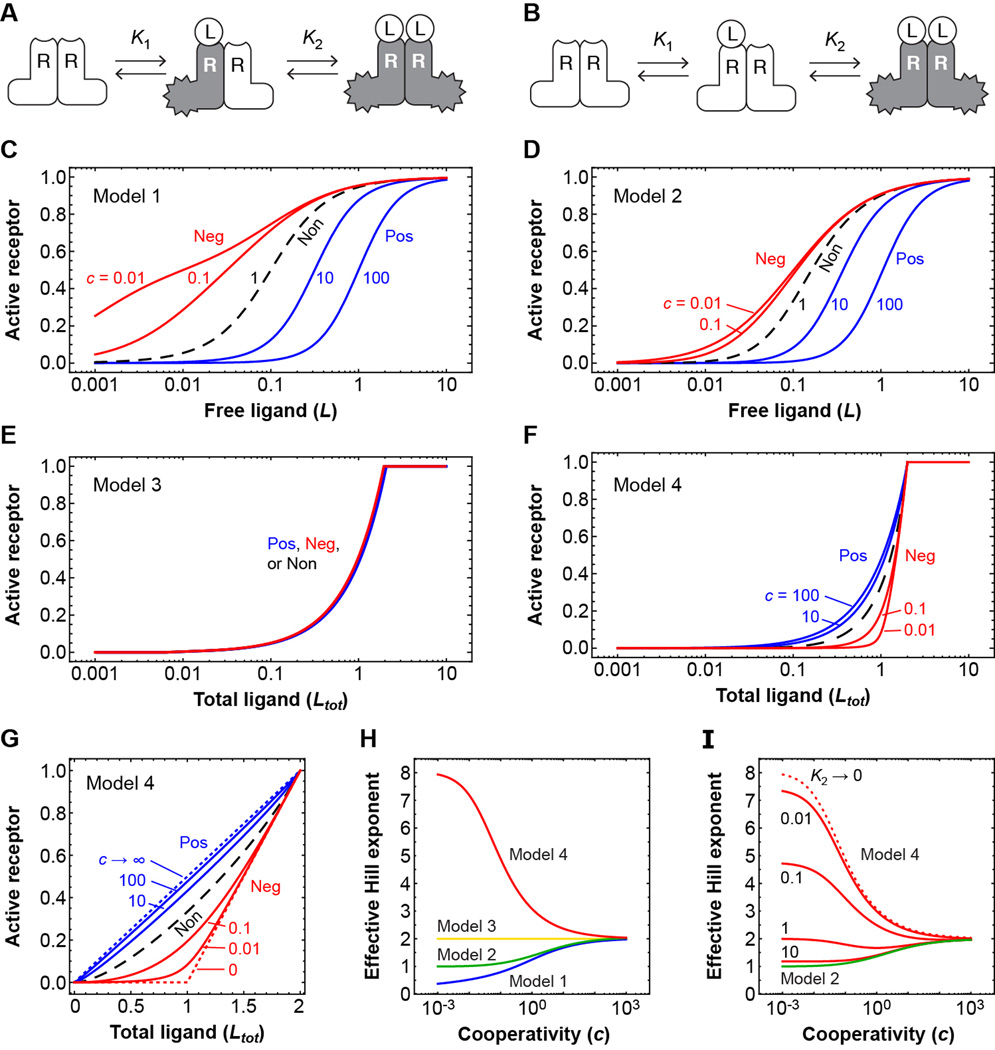
Fig. 1. Negative cooperativity can produce a sharp threshold in the response of a dimeric receptor to a high affinity ligand.
(A and B) Schematic view of the sequential binding of a ligand to a stable dimeric receptor, assuming (A) the receptor subunits are activated independently by ligand binding, or (B) the receptor is activated only when two ligands are bound. (C to F) Receptor activity as a function of free ligand concentration [(C) and (D)] or total ligand concentration [(E) and (F)] for various assumed degrees of cooperativity. In each panel, the blue curves correspond to positive cooperativity; the dashed black curve corresponds to independent binding with c = 1; and the red curves correspond to negative cooperativity. In panels (C) and (D) it is assumed that K2 = 0.1; higher or lower values would shift the curves to the right or left, but would not alter the shapes of the curves. In panels E and F, it is assumed that the binding affinities are very high and the equilibrium constants approach zero. (G) Linear plots of receptor activation as a function of total ligand concentration for Model 4. (H) The effective Hill exponents as a function of the cooperativity c for the four models. The Hill exponents are calculated as described by Koshland and Goldbeter (3, 24): nH = log10[81] / log10[EC90 / EC10], where EC90 is the concentration of ligand that yields a 90%-maximal response, and EC10 is the concentration that yields a 10%-maximal response. (I) The effect of decreasing the ligand-receptor affinity on the effective Hill exponents for Model 4. Details of the theory can be found in the Supplementary Materials. Log-log plots of the stimulus-response curves and plots of the local response sensitivities can be found in figure S1.

