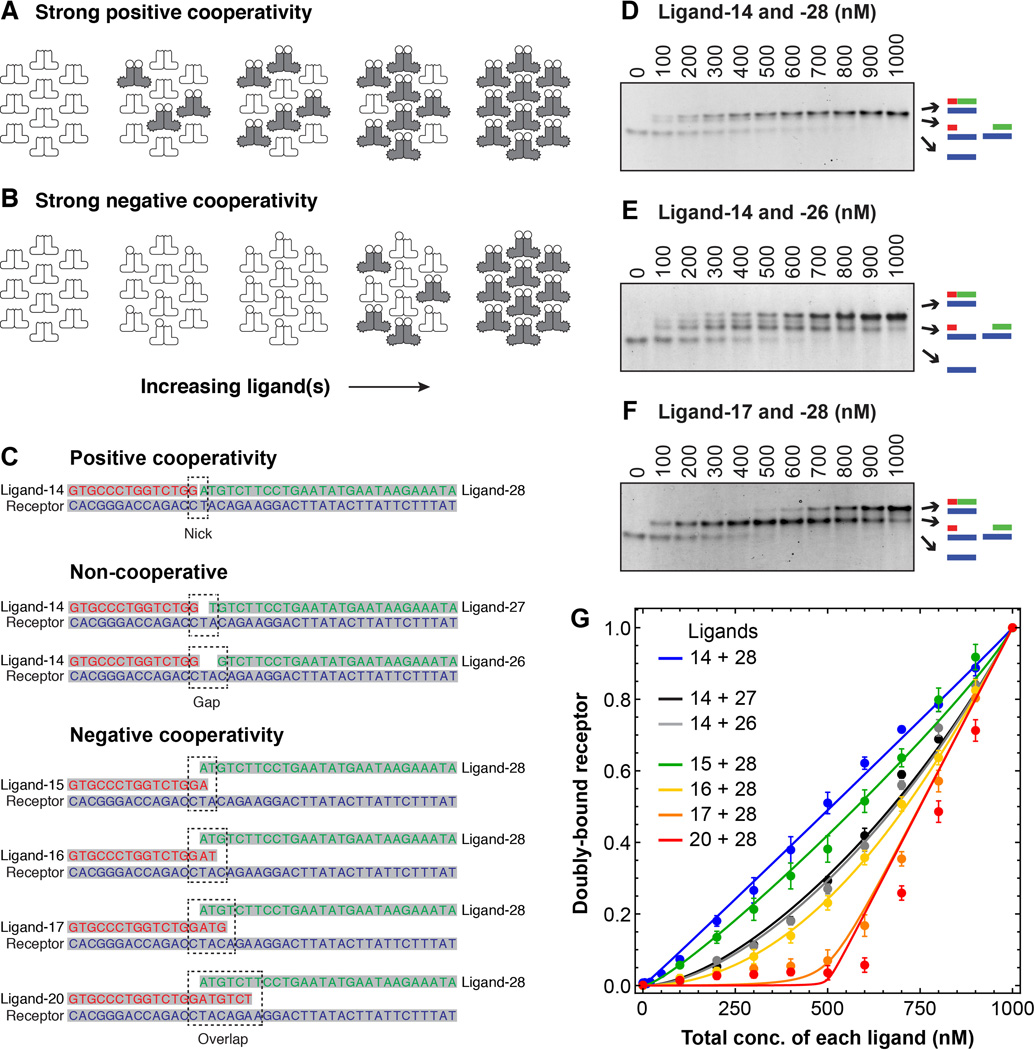
Fig. 2. The effects of positive and negative cooperativity on response thresholds in a DNA annealing model of receptor-ligand interaction.
(A and B) Schematic view of how increasing the ligand concentration at fixed receptor concentration would be expected to affect the formation of full ternary complexes in the case where binding is strongly positively cooperative (A) or strongly negatively cooperative (B). (C) Oligonucleotides used for the binding studies. The first pair was expected to exhibit positive cooperativity due to base stacking at the junction between the two ligand oligos. The next two pairs were expected to exhibit independent non-cooperative binding because of the gap between the two ligands. The four pairs labeled “negative cooperativity” were expected to exhibit either net negative cooperativity, or at least less positive cooperativity than ligands 14 + 28. See table S1 for further discussion of the expected annealing energies and cooperativities for the seven ligand pairs. (D to F) Analysis of three binding reactions by native polyacrylamide gel electrophoresis. The total receptor concentration was 1000 nM, and the two ligands were both present at the concentrations indicated. Primary binding data for the four other ligand pairs can be found in figure S2. (G) Cumulative data for all seven ligand pairs. Points represent means ± S.E. from five (all but the data for ligands 14 + 28) or ten (the ligand 14 + 28 data) experiments. The curves are fits of the data to Eq 12 from the Supplementary Materials section.

