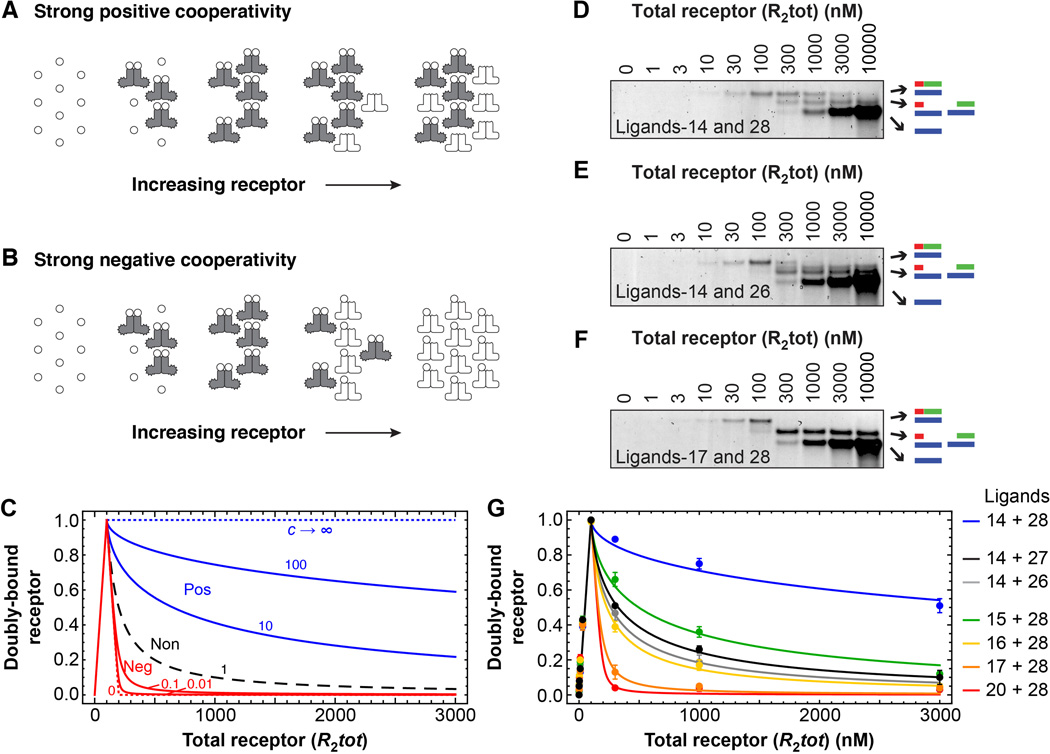
Fig. 3. Biphasic responses as the total receptor concentration is varied.
(A and B) Schematic view of the formation of ternary complexes as a function of receptor concentration where binding is strongly positively cooperative (A) or strongly negatively cooperative (B). (C) Theoretical binding curves based on Model 4 and Eq 12 from the Supplementary Materials. The total ligand concentration was assumed to be 200 arbitrary units. (D to F) Analysis of three binding reactions by native polyacrylamide gel electrophoresis. In each case, the concentration of each ligand was 100 nM and the total receptor concentration was varied as indicated. Primary binding data for the four other ligand pairs can be found in figure S3. (G) Cumulative binding data for all seven ligand pairs. Points represent means ± S.E. from three to eight experiments. The curves are fits of the data to Eq 12 from the Supplementary Materials section.

