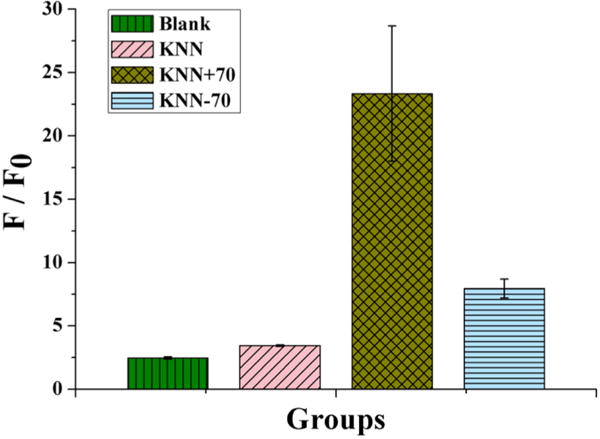
Figure 3.

Quantification of the ROS level. The DCFH fluorescence intensity was tested after different substrates were cocultured with S. aureus for 24 h. F and F0 are the fluorescence intensities of the experimental group and the positive control included in the commercial kit, respectively. F/F0 is the relative ROS intensity of the experimental group. The results demonstrate that the ROS level of KNN+70 is higher than those of the other groups (Blank, KNN, and KNN−70).
