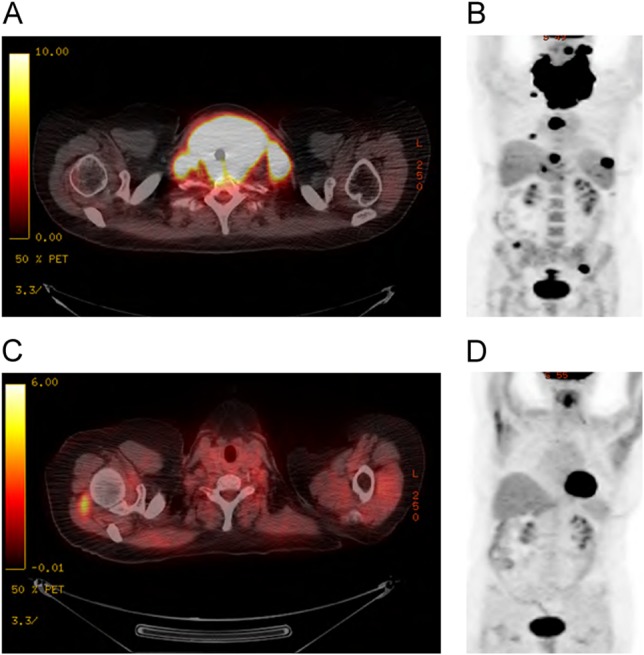
Figure 1:

PET–CT imaging of DLBCL infiltration of the thyroid gland. PET–CT images before and after chemotherapy treatment. These demonstrate infiltration of the thyroid gland with cervical lymphadenopathy (A, B). Re-staging PET–CT images following six cycles of Rituximab-CHOP showing complete resolution of the abnormalities (C, D)
