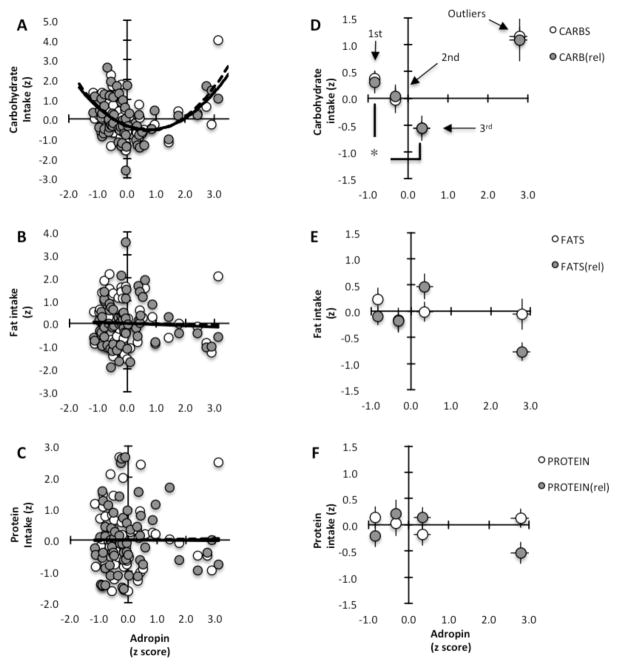
Figure 2. Association between plasma adropin concentration and carbohydrate intake.
The macronutrient intake data (in kJ per person, or expressed relative to other macronutrients) and plasma adropin concentration data were converted into z-scores (±SD from the mean) to allow plotting total and relative intake data on the same graph. White circles = total intake; grey circles = intake relative to other macronutrients; n=62
(A–C) Scatterplots showing a nonlinear association between plasma adropin concentration (x-axis) and carbohydrate intake (y-axis) (A); no associations were evident for fats (B) or protein (C).
(D) Carbohydrate intake of the 58 participants whose plasma adropin concentrations were within 2 SD of the mean separated into tertiles with low-normal (1st tertile, n=19), normal (2nd tertile, n=20) or highnormal (3rd tertile, n=19) plasma adropin concentrations. Carbohydrate intake (in total or relative to other macronutrients) in the 1st and 3rd tertiles was significantly different (* P<0.01). The means of the 4 participants whose plasma adropin concentrations were >2SD from the mean (“outliers”) are also shown.
(E–F) Intake of fats (E) and protein (F) by tertile.

