
Table 2.
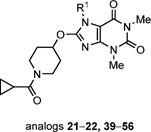
SAR of R1 Portion of Theophylline-Based ALDH1A1 Inhibitors
 | |||
|---|---|---|---|
| analogs 21–22, 39–56 | |||
| Cpd | R1 | hALDH1A1 IC50 ± SD (nM)a |
RLMb (t1/2, min) |
| 21 | 214 ± 28 | > 30 | |
| 22 | H | 25.1 ± 5.9 (µM) | > 30 |
| 39 | 629 ± 179 | 14 | |
| 40 |  |
1.8 ± 1.5 (µM) | 8 |
| 41 |  |
1.5 ± 0.5 (µM) | > 30 |
| 42 |  |
545 ± 174 | > 30 |
| 43 |  |
177 ± 49 | 21 |
| 44 | 876 ± 250 | 21 | |
| 45 |  |
285 ± 101 | 20 |
| 46 |  |
153 ± 49 | 24 |
| 47 |  |
131 ± 60 | 4 |
| 48 |  |
12.5 ± 6.4 (µM) | > 30 |
| 49 |  |
91 ± 33 | 2 |
| 50 | 3.9 ± 1.3 (µM) | > 30 | |
| 51 | 81 ± 11 | 3 | |
| 52 | 76 ± 11 | 17 | |
| 53 | 555 ± 173 | 25 | |
| 54 | 30 ± 12 | 1 | |
| 55 | 3.9 ± 0.7 (µM) | 1 | |
| 56 | > 57 (µM) | > 30 | |
a
Values with standard deviation (SD) represent the average of three to six runs from one to two experiments. The IC50 values are shown in nM unless otherwise specified.
b
RLM represents rat liver microsomal stability conducted at NCATS in the presence of NADPH.