
Fig. 5.
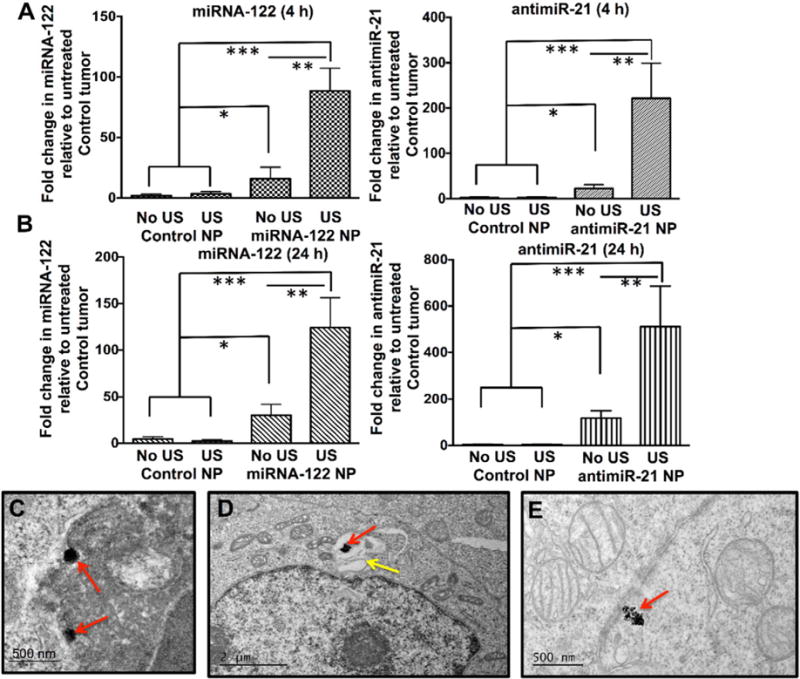
Quantitative RT-PCR assessment of non-resistant human HCC xenografts in mice intravenously injected with either control PLGA-NP (no miRNA loading) or with miRNA-loaded PLGA-NP that were either treated or not treated with ultrasound (US). (A) shows fold increase of respective miRNA levels at 4 h, (B) shows them at 24 h following treatment. *, P = 0.005, **, P = 0.002; ***, P = 0.001, all compared to untreated control tumors; n = 5 each. Representative TEM image shows internalization of PLGA-NP (red arrows) into a HCC cell (C) through endocytosis. (D) PLGA-NP (red arrow) is shown within a vesicular structure (yellow arrow) in a HCC cell by TEM. (E) Degrading PLGA-NP (red arrow) aggregates in the cytoplasm of a HCC cell (red arrow).