
Fig. 6.
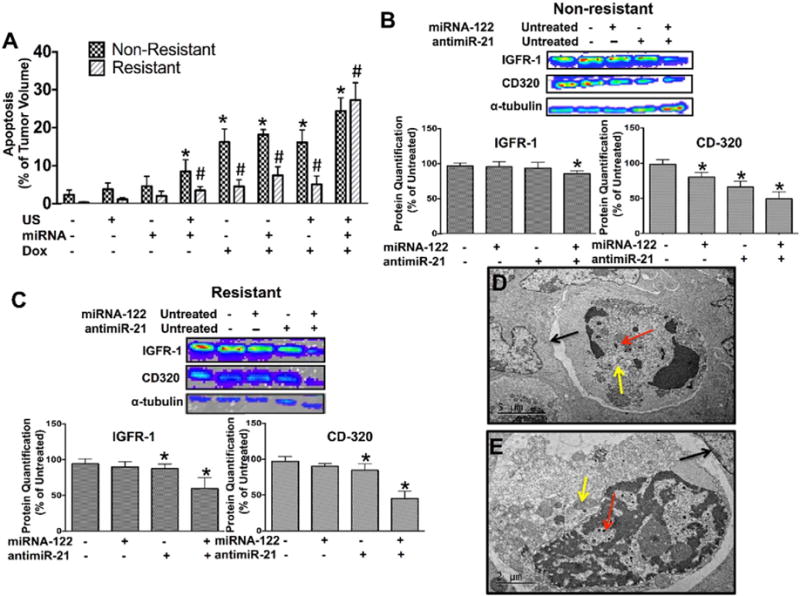
(A) Bar graphs summarizing mean and standard deviations of % tumor volume apoptosis calculated from TUNEL stained non-resistant and doxorubicin-resistant HCC xenograft sections show highest extent of apoptosis in tumors treated with the miRNA combination therapy. * and #, P < 0.05 compared to untreated control tumors; n = 5 each. Western blotting and quantitative bar graph summary (mean ± standard deviations) of treatment effects on down-stream anti-apoptotic proteins, IGFR-1 and CD320, in non–resistant (B) and resistant (C) human HCC xenografts treated with miRNA-122 and antimiR-21, either isolated or in combination. *, P < 0.05 compared to control tumors; n = 3 each. α tubulin was used as loading control. (D and E) TEM images show HCC cells with multiple internalized PLGA-NP (red arrows), double layered vacuolar structures in the cytoplasm (yellow arrows) and evidence of detachment from surrounding HCC cells (black arrows), indicating apoptosis.