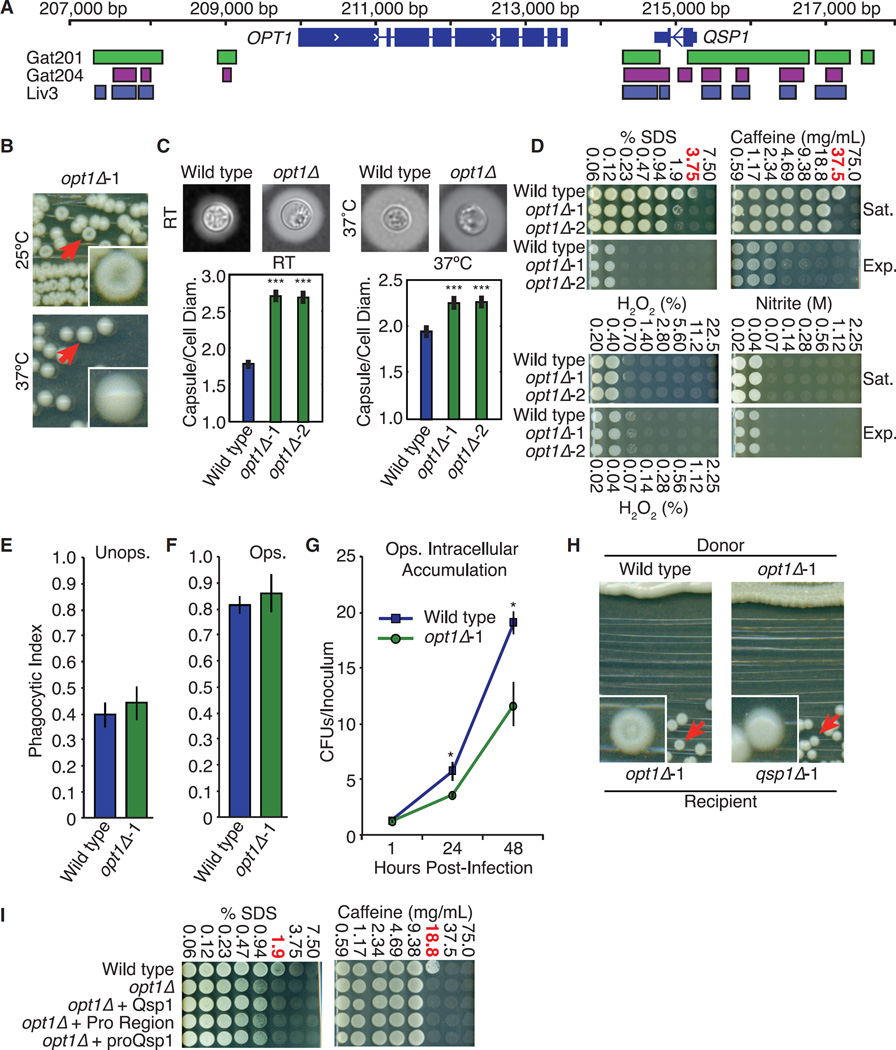
Figure 6. A Predicted Oligopeptide Transporter Is Required for Cells to Respond to Qsp1.
(A) Transcription factor binding sites near QSP1 and OPT1.
(B) Colony morphology.
(C) Capsule sizes. Cryptococcal capsule stained with India ink. >100 cells per genotype quantified. ***p < 10−5 (t test). Wild-type data from Figure 3 included for comparison. Error bars are SE.
(D) Stress assays. The concentration where qsp1Δ viability is most different from wild-type is shown in red. Wild-type data from Figure 4 included for comparison.
(E and F) Phagocytic index of unopsonized (E) and opsonized (F) C. neoformans. >1,200 BMDMs quantified per genotype. Wild-type data from Figure 2 included for comparison. Error bars are SD.
(G) Macrophage intracellular accumulation assay. CFUs isolated from BMDMs, normalized to starting inoculum. Wild-type data from Figure 2 included for comparison. Error bars are 95% confidence intervals. *p < 0.05 (bootstrap).
(H) Complementation assays.
(I) Stress assays as described in (D).

